Explore Application Performance
Introduction
After completing the Kubernetes and App Service Monitoring Deployment with OpenTelemetry for APM, you can begin tracking the performance of your application services and related entities. This is achieved through various views and selections, offering detailed insights into the specific entity being monitored.
Navigate the Application Performance Monitoring Domain
You will acquire skills to pinpoint and interpret key application metrics, comprehend the interconnections among different entities, and leverage this understanding to resolve application-related problems.
There are three main entities in the APM Domain:
- Services
- A Service is a software component designed for a specific task and may include numerous Service Instances.
- Service Instances
- A specific realization of a Service, executing tasks and utilizing resources, with a Service potentially consisting of multiple such instances
- Business Transactions
- Encompass essential services like login and checkout, reflecting user interactions across various applications and systems.
When in the APM domain, you can navigate and cross-corelate the performance with related entities from other domains, such as Kubernetes Domain
Services
Cisco Cloud Observability offers detailed insights into Service entities. A Service, functioning as a specific software module, may encompass multiple Service Instances, each performing designated tasks
CCO enables you to view data detail in two ways:
- Flow - provides a data-flow pictorial of Service interactions with other entities. Flow is the default view.
- List - data displays in a table where some columns are sortable.
Navigate to your CCO tenant via the CCO Tenant URL.
Go to the Observe page and adjust the view to specifically target your cluster. Appending && attributes(service.namespace) = 'cco_lab_id' to the existing filter. Ensure you replace cco_lab_id with the actual environment variable from your Cloud9 environment.
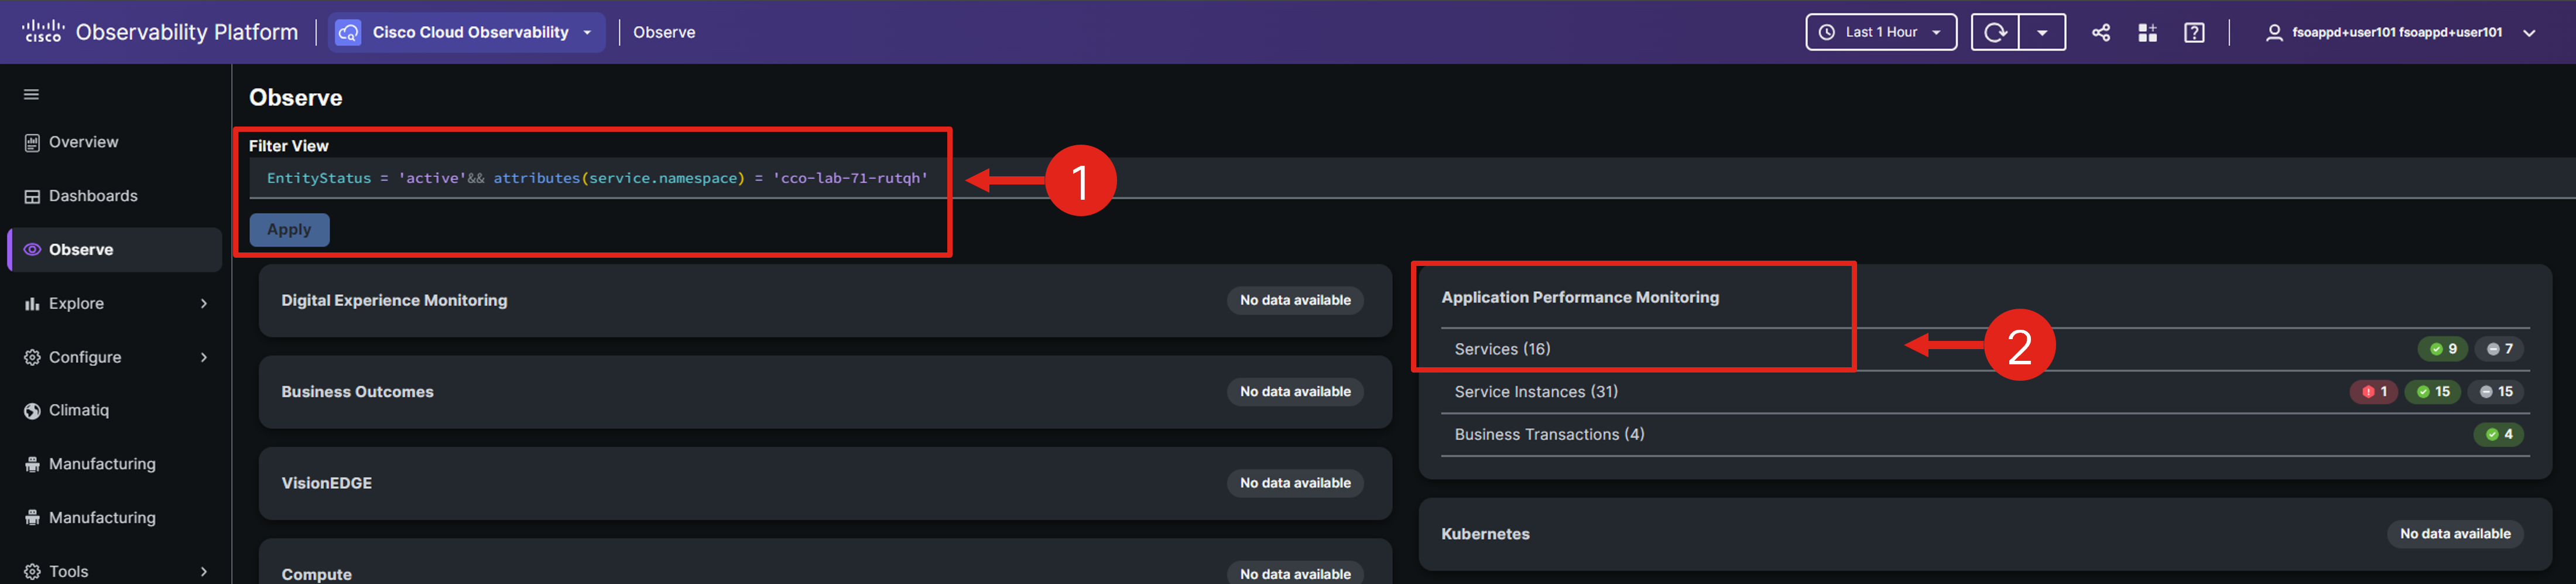
Note: You can adjust the time range in the upper-right corner, which will update the data displayed in the views to reflect the chosen time period.
Click the Services entity within the Application Performance Monitoring domain.
To filter only the services with errors, add && metrics('apm:errors_min') > 0 to the current filter.
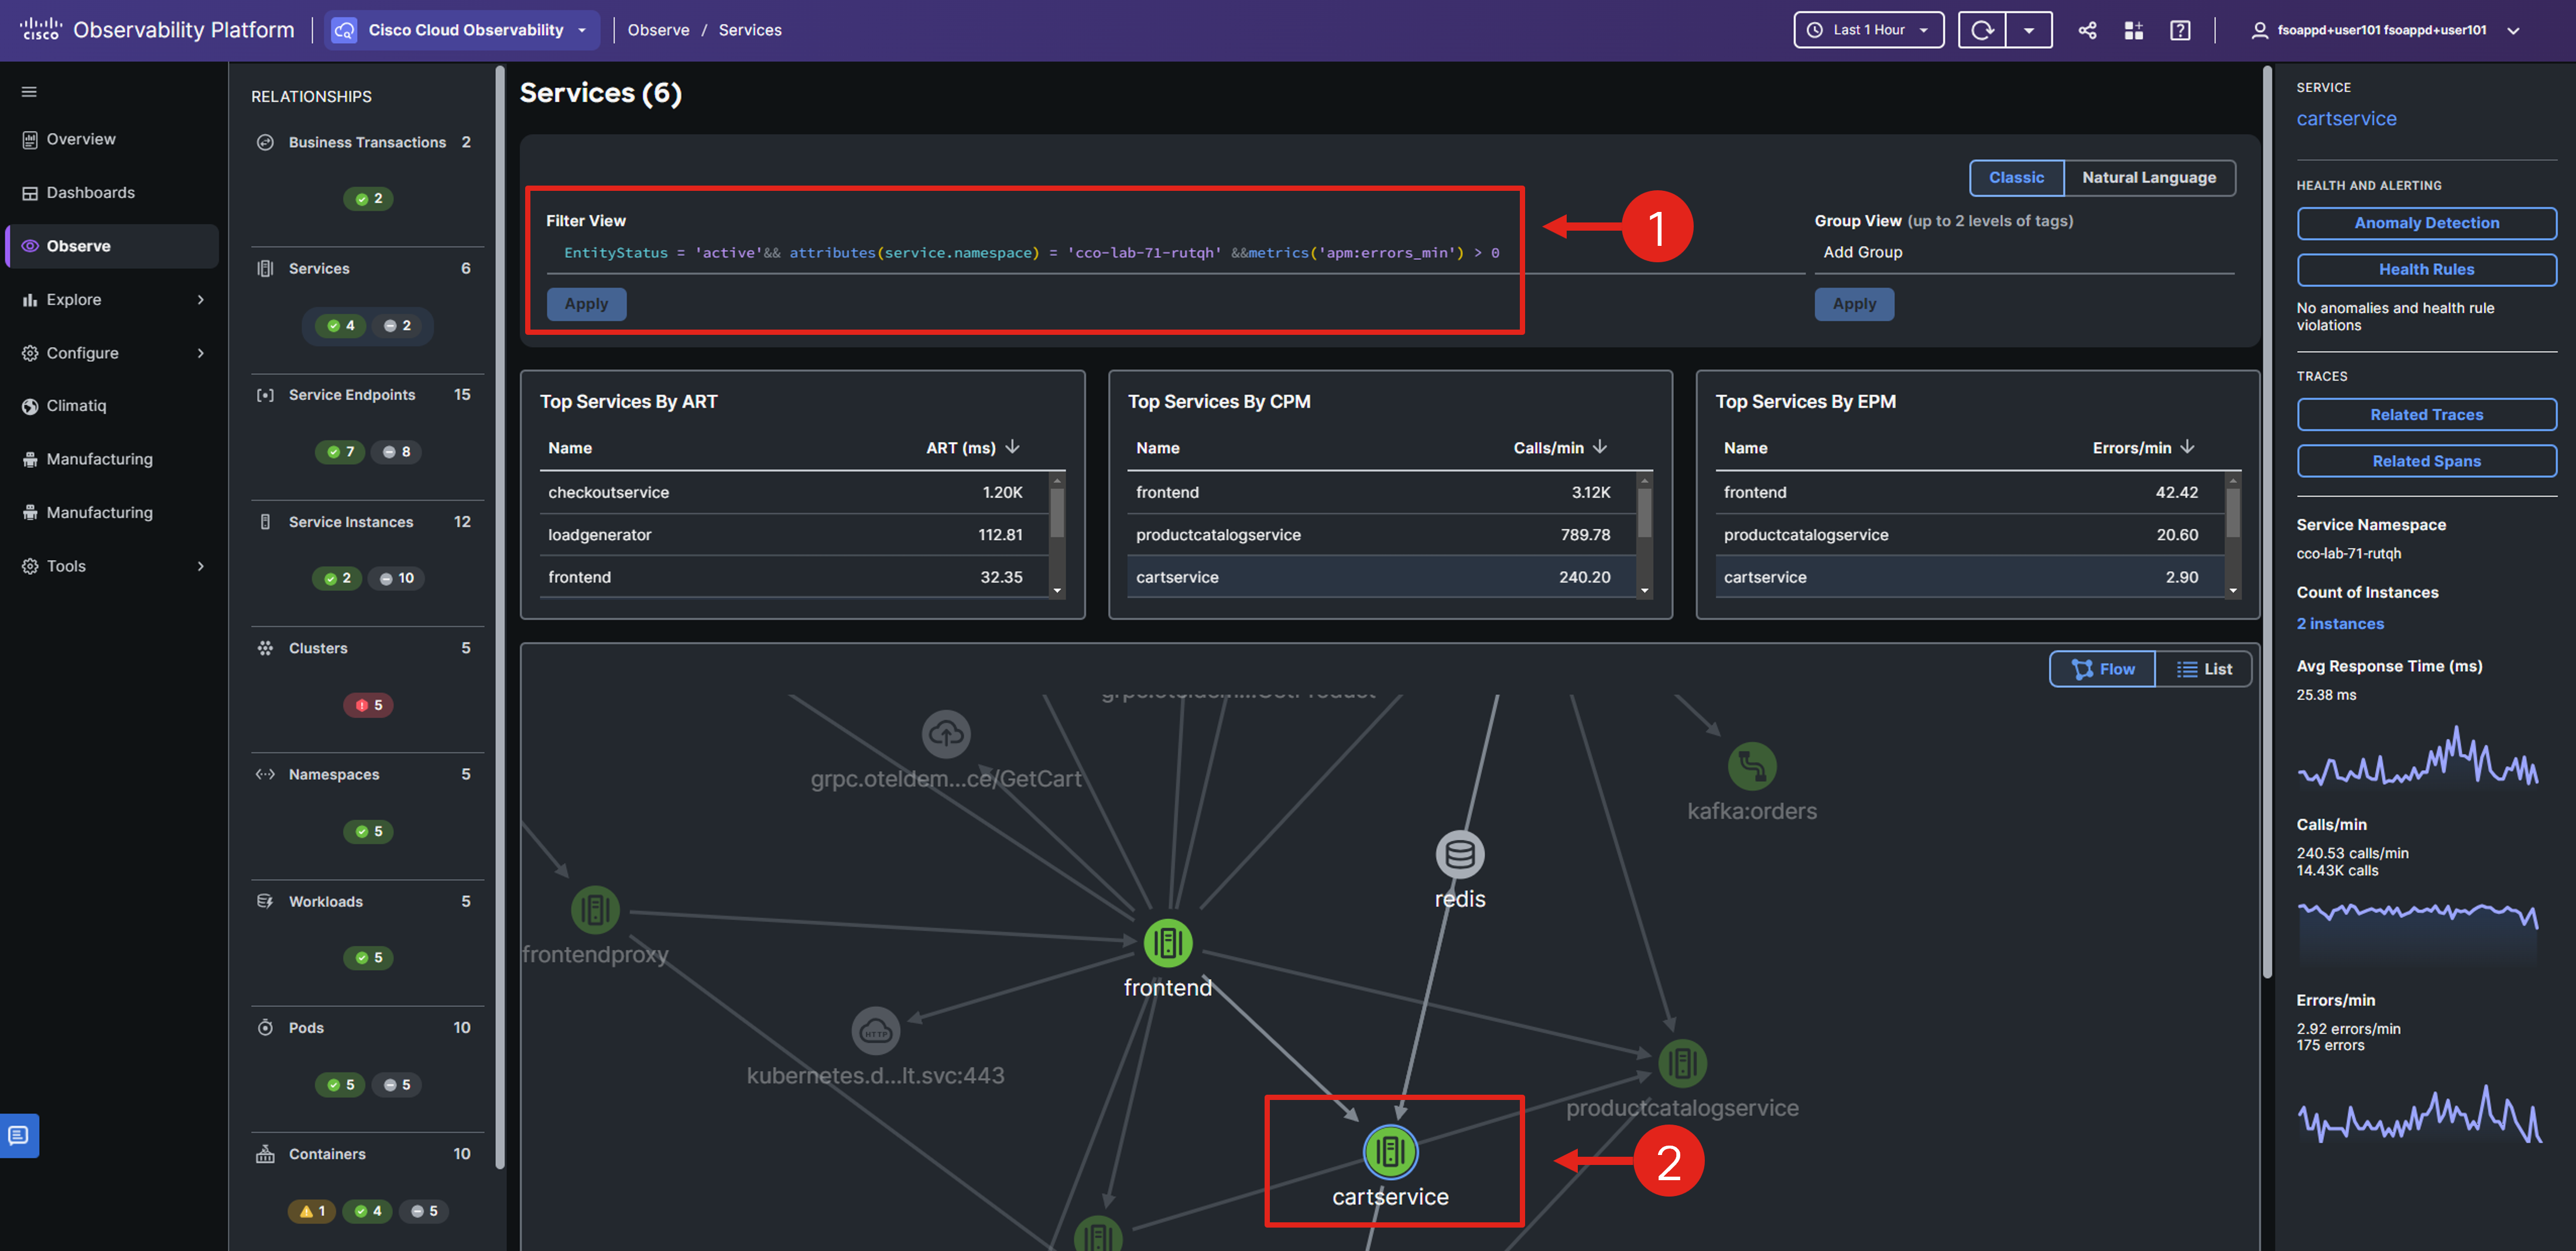
The widgets and the flow map view should adjust so you can focus only on services with errors.
Double-click the cartservice in the flow map.
You should see a single service entity along with a flow map specifically for the cartservice.
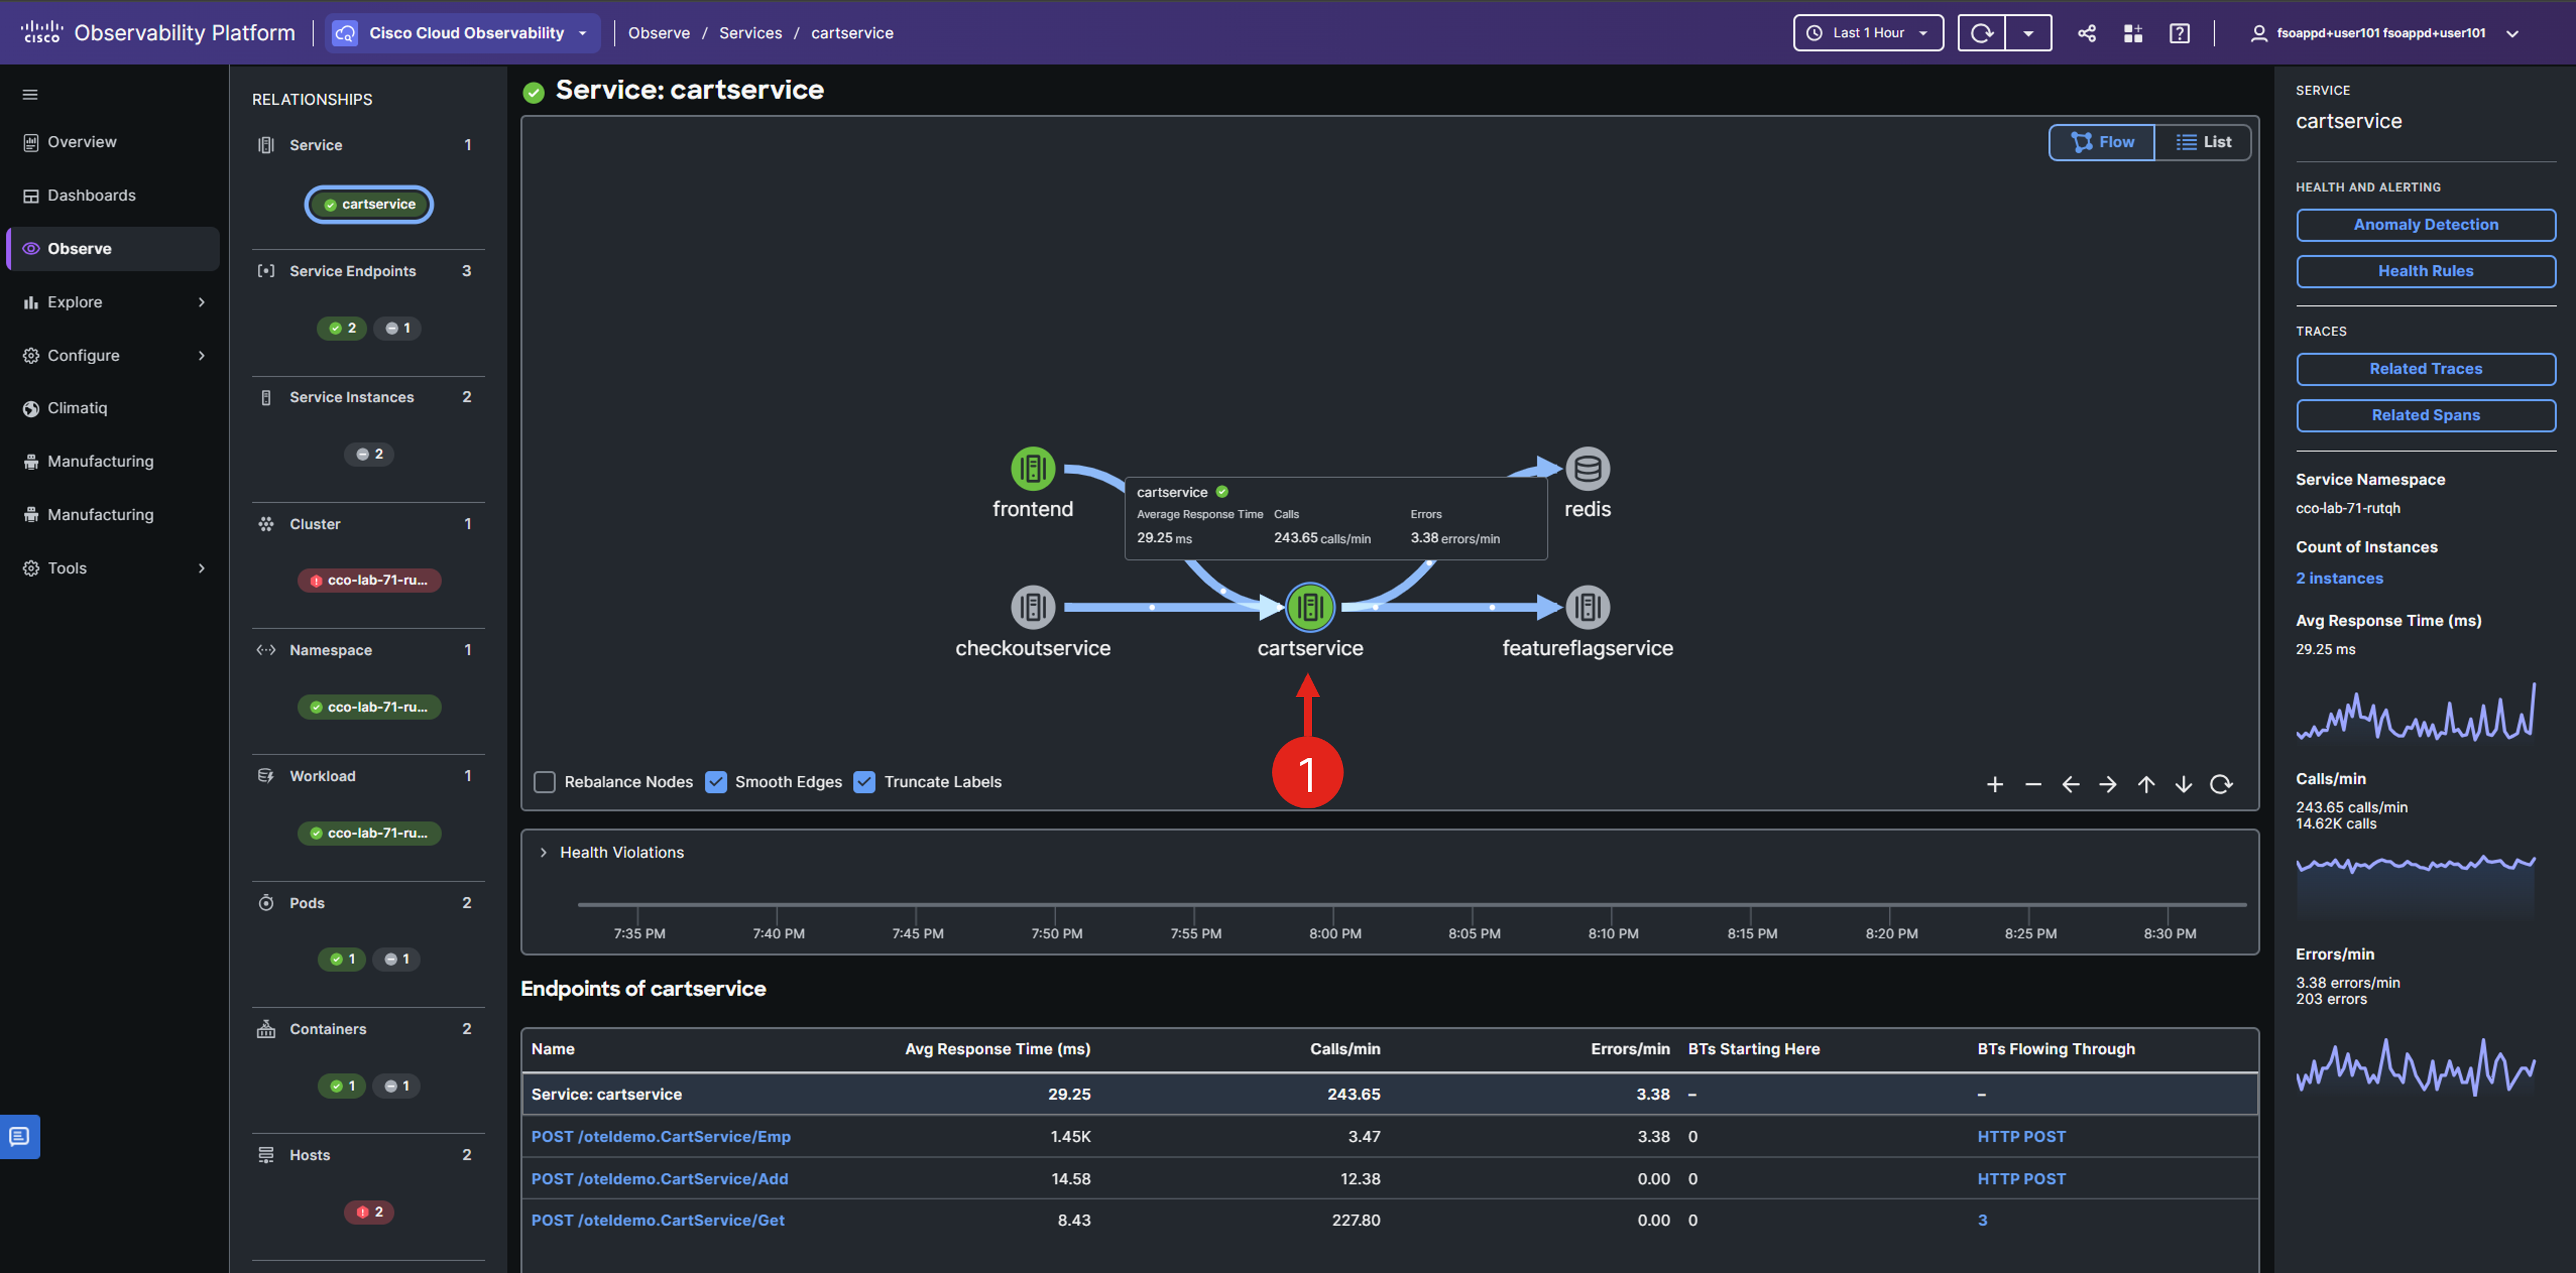
On the service details page, you’ll find the service’s relationships with other entities, options to view related services in flow or list format, service metrics, and navigation options to delve into service traces and spans.
Scroll down to view the service endpoints and their associated metrics.
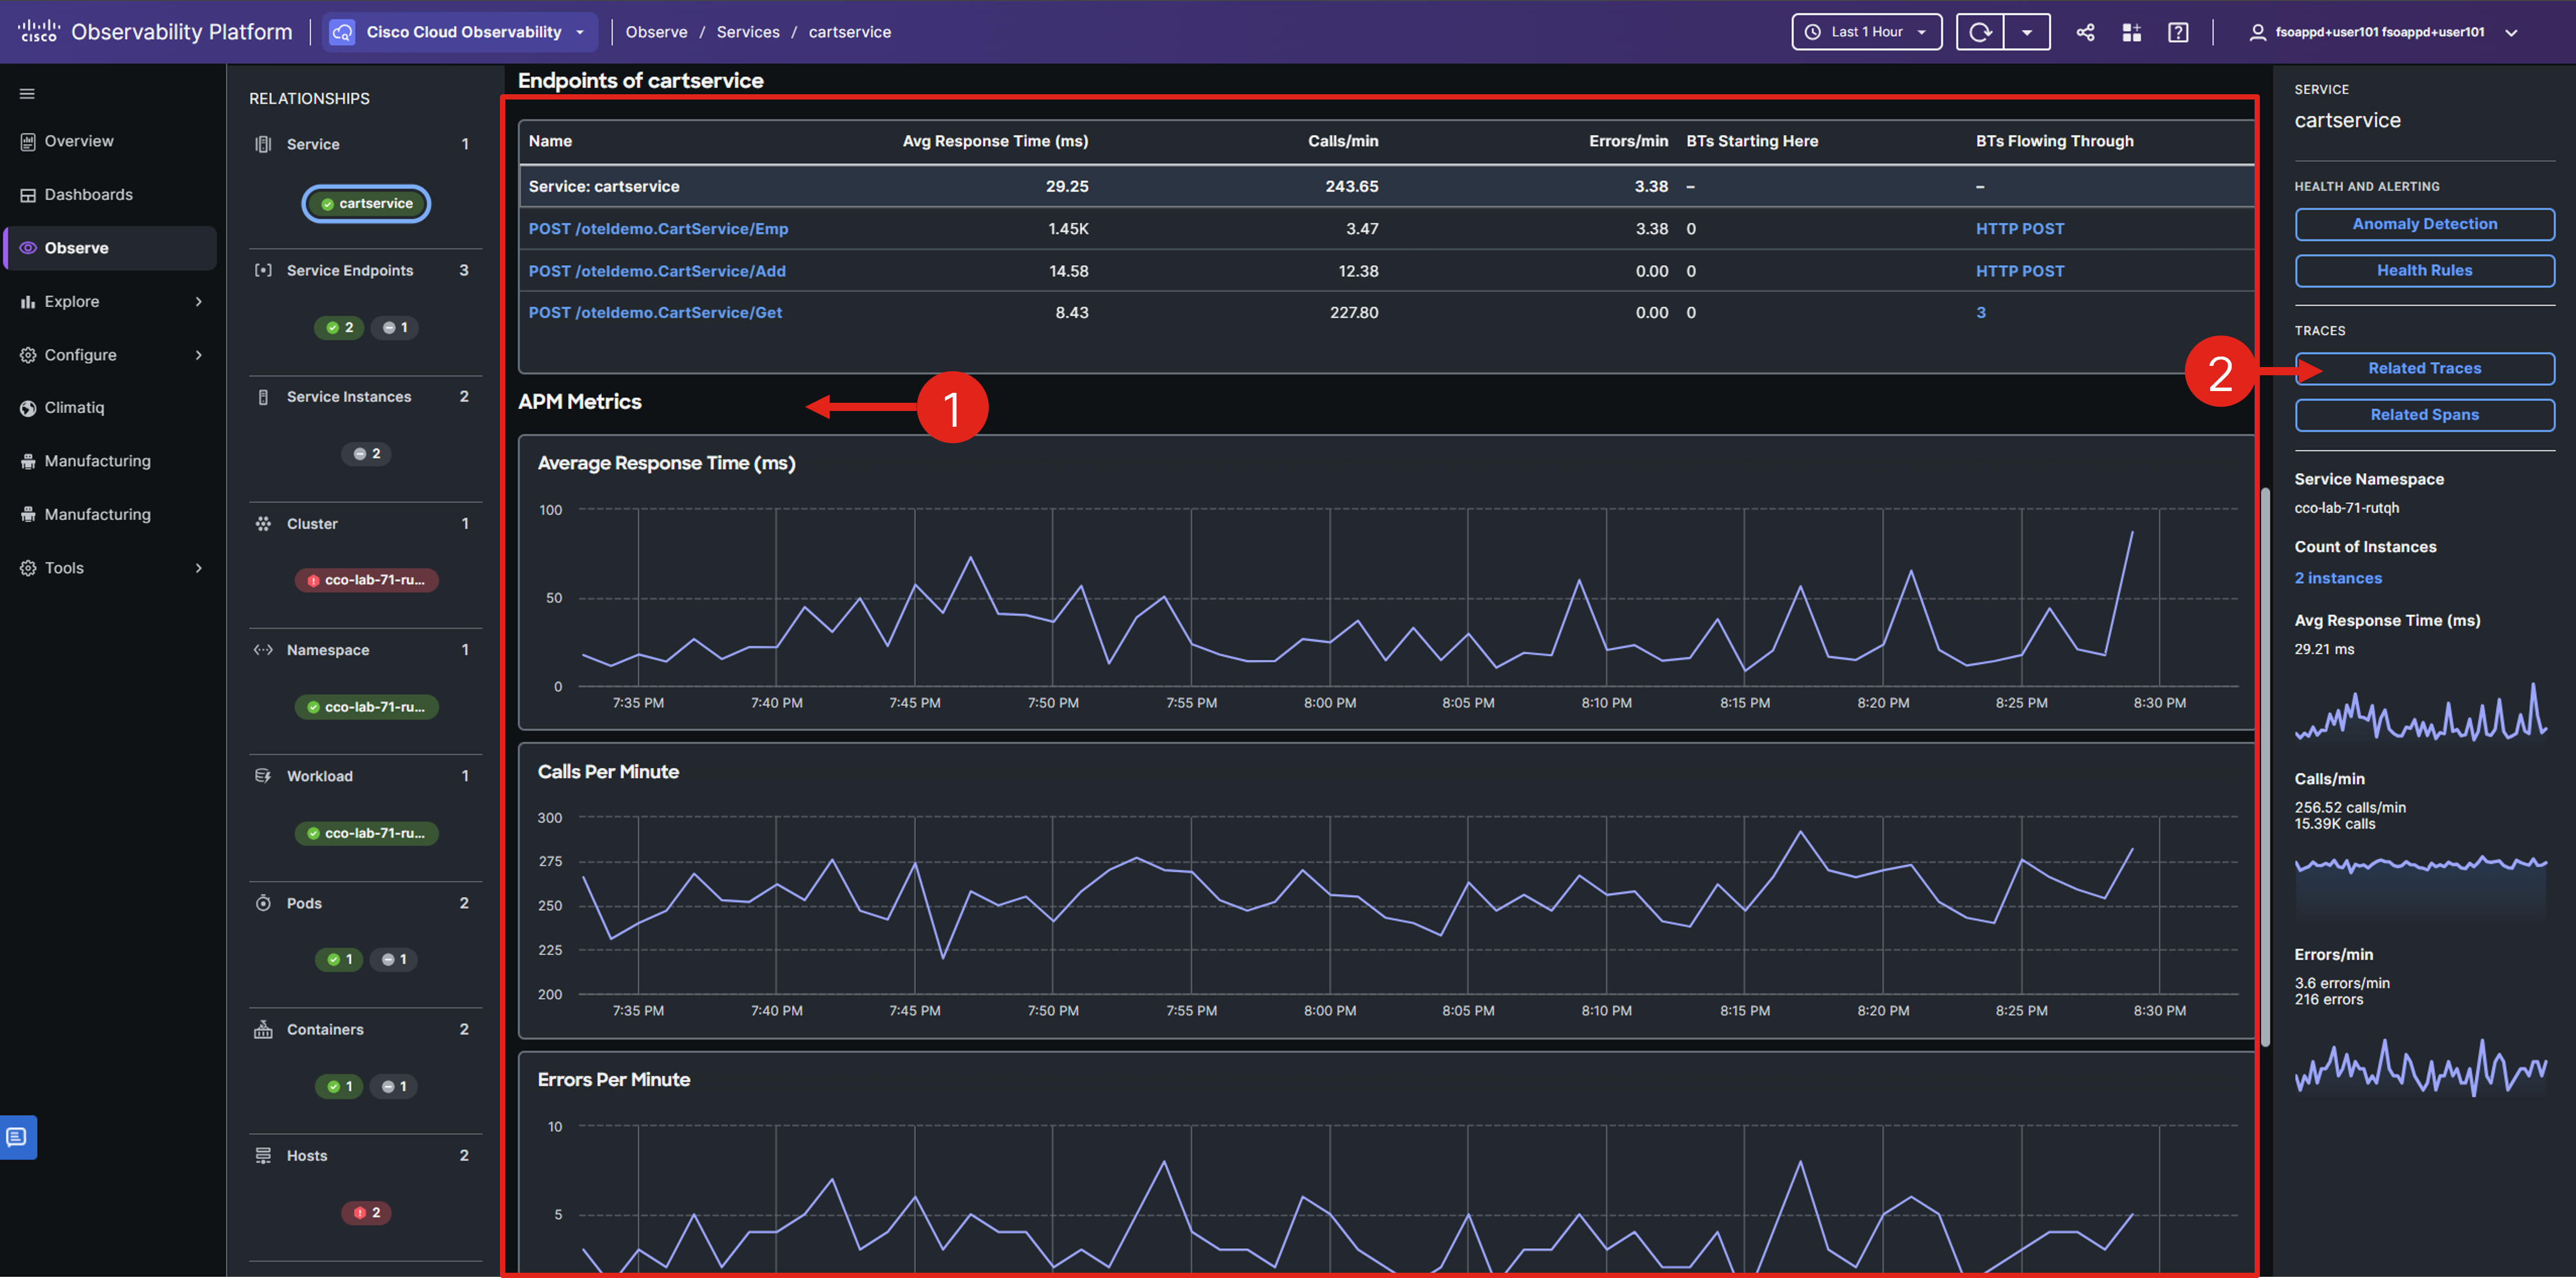
In the Service detail view, you can easily check if the specific service has a higher average response time or an unusual increase in requests.
Select the Related Traces button in the right-hand Service panel.
Sort the traces by duration by clicking on the Duration column heading, then select the first trace by clicking its Trace ID.
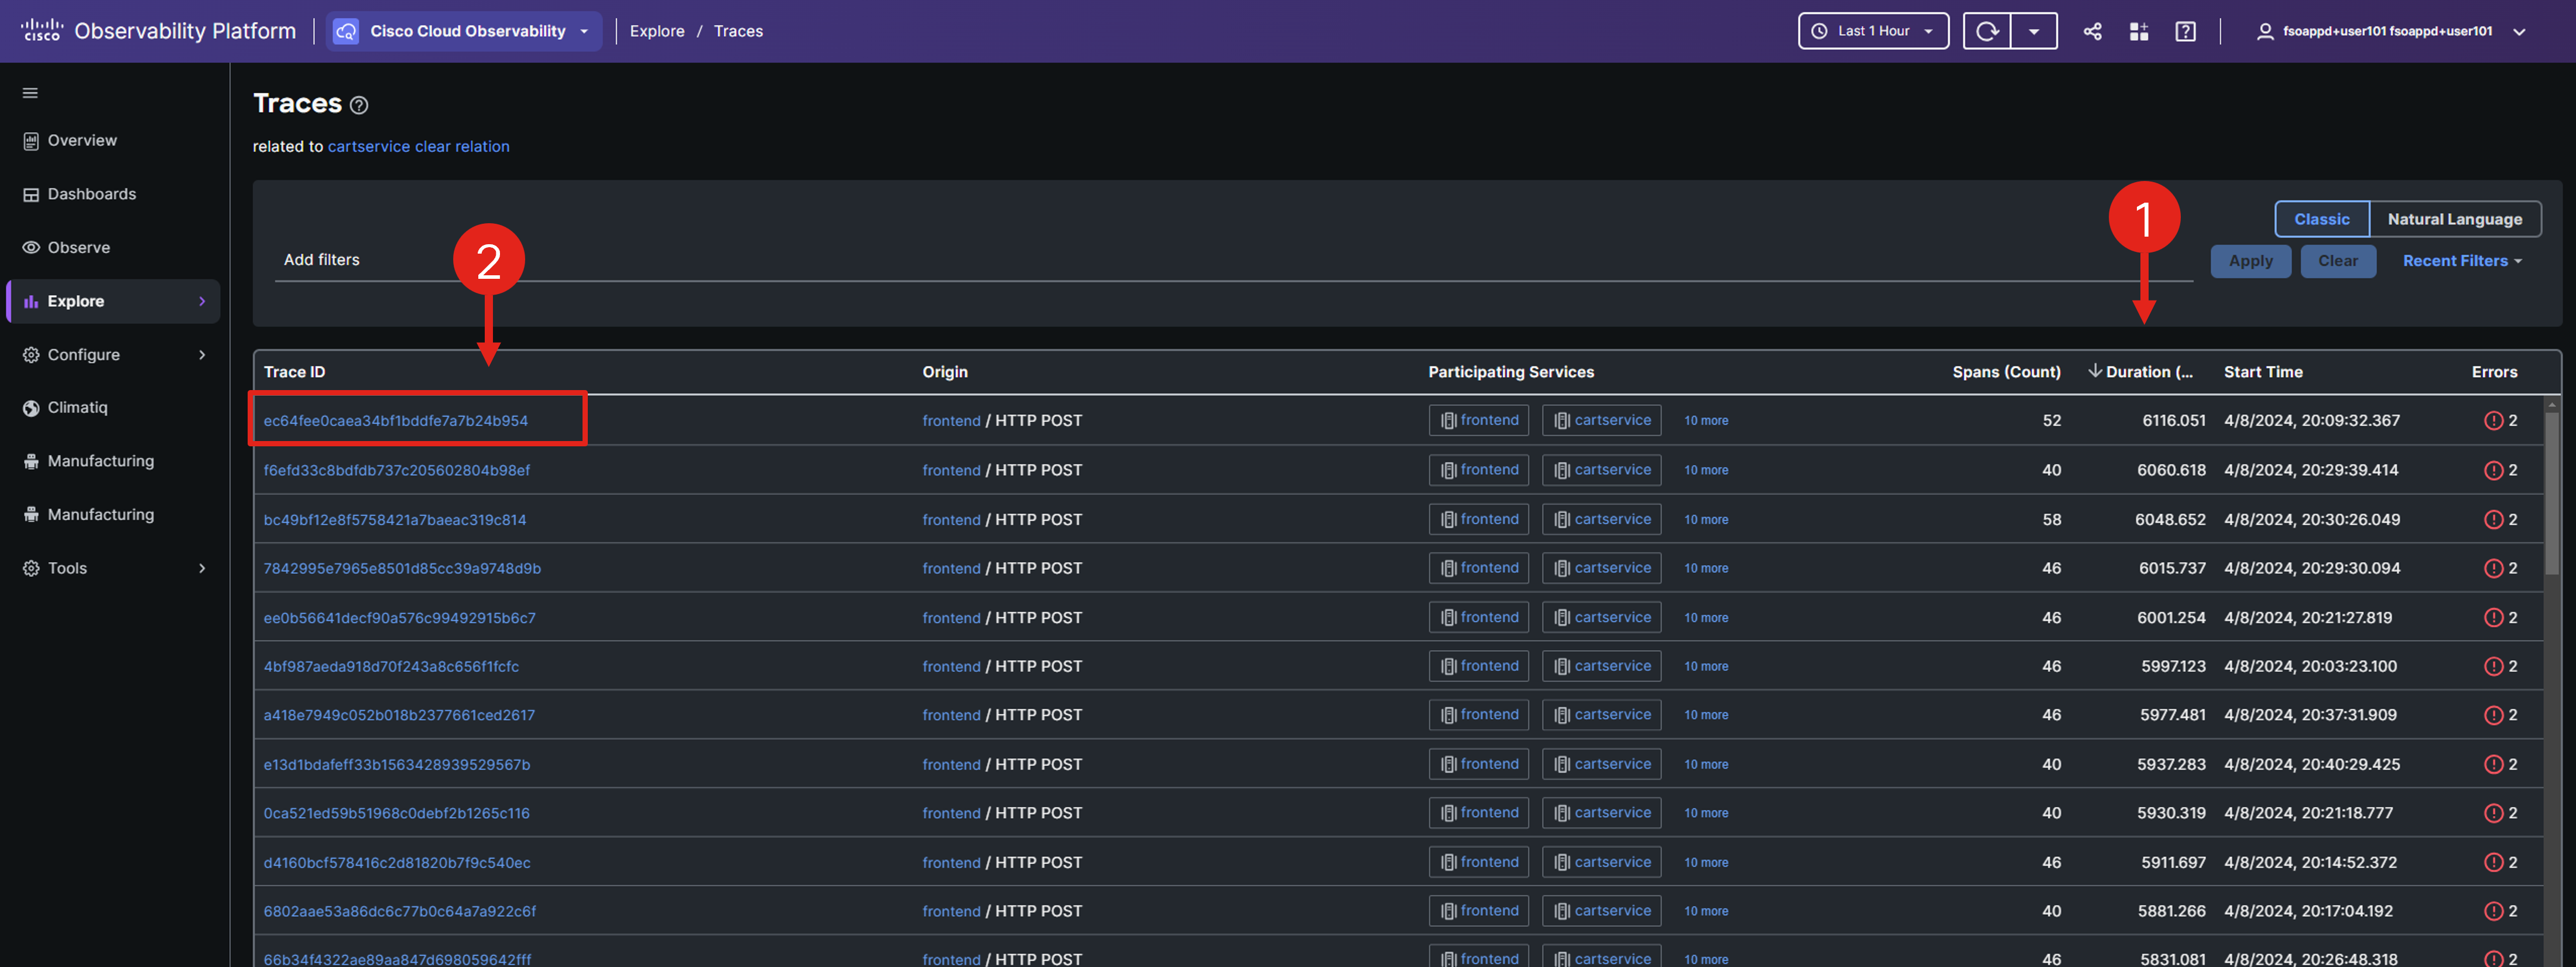
Cisco Cloud Observability offers detailed insights into OpenTelemetry Traces, which are transactions through your system. Each Trace comprises multiple Spans, each representing a service or unit involved in the transaction. Traces are crucial for identifying the root causes of errors or performance issues in a distributed system.
Note the last column which indicates that most of the traces have errors.
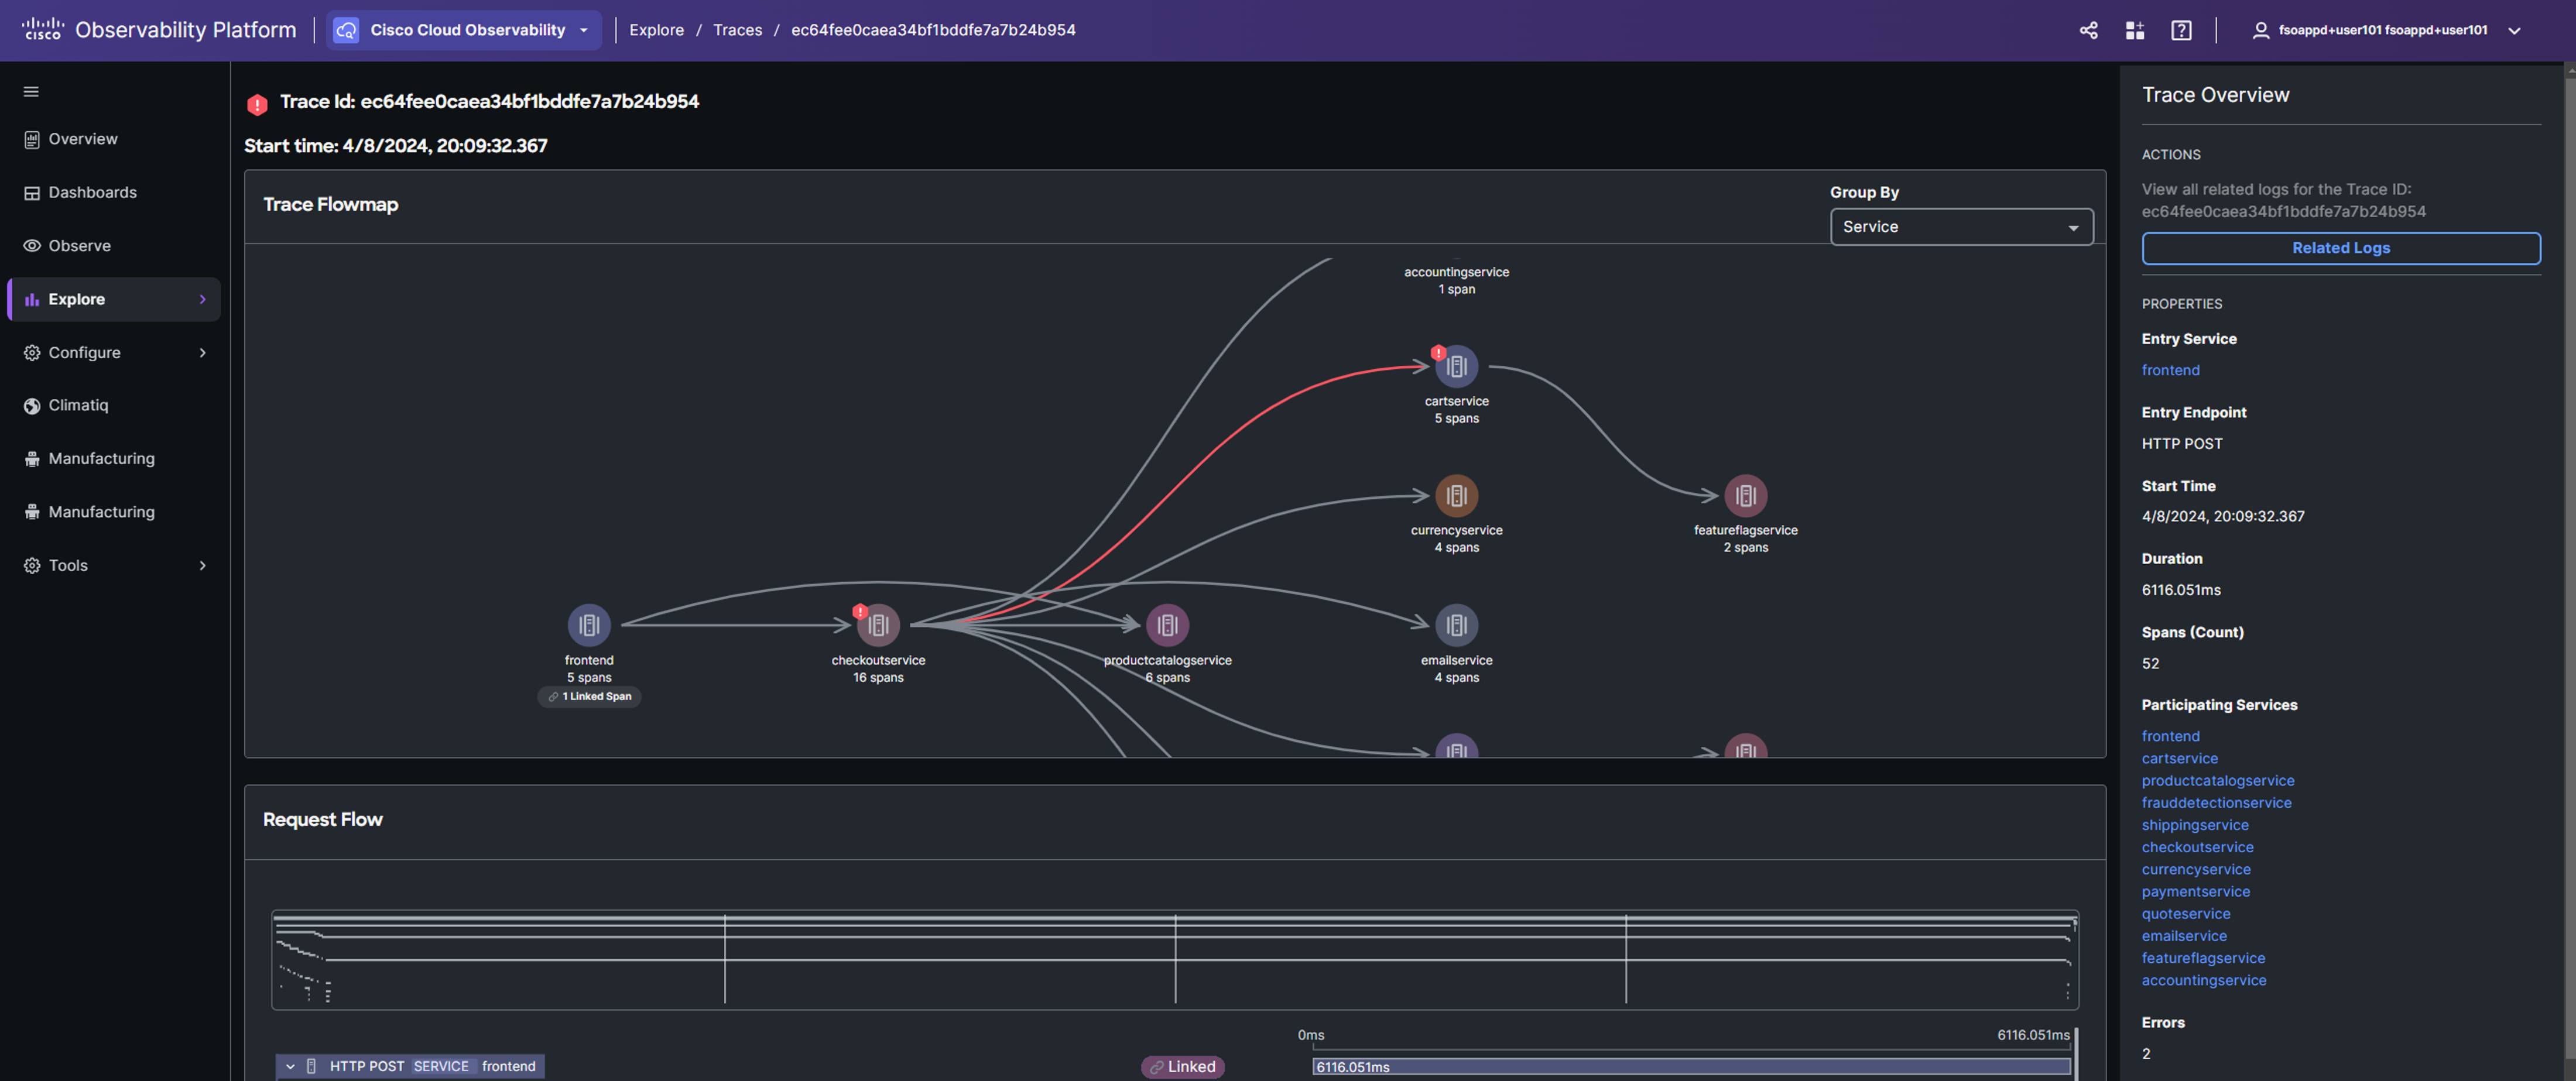
The Trace properties panel displays key details like Entry Service, Start Time, and Error. The Trace Flowmap visually represents the transaction flow through services, with each node labeled by service name. Clicking a node reveals related span details in the Properties panel and highlights the span in the request flow timeline.
Scroll down to view the Request Flow timeline.
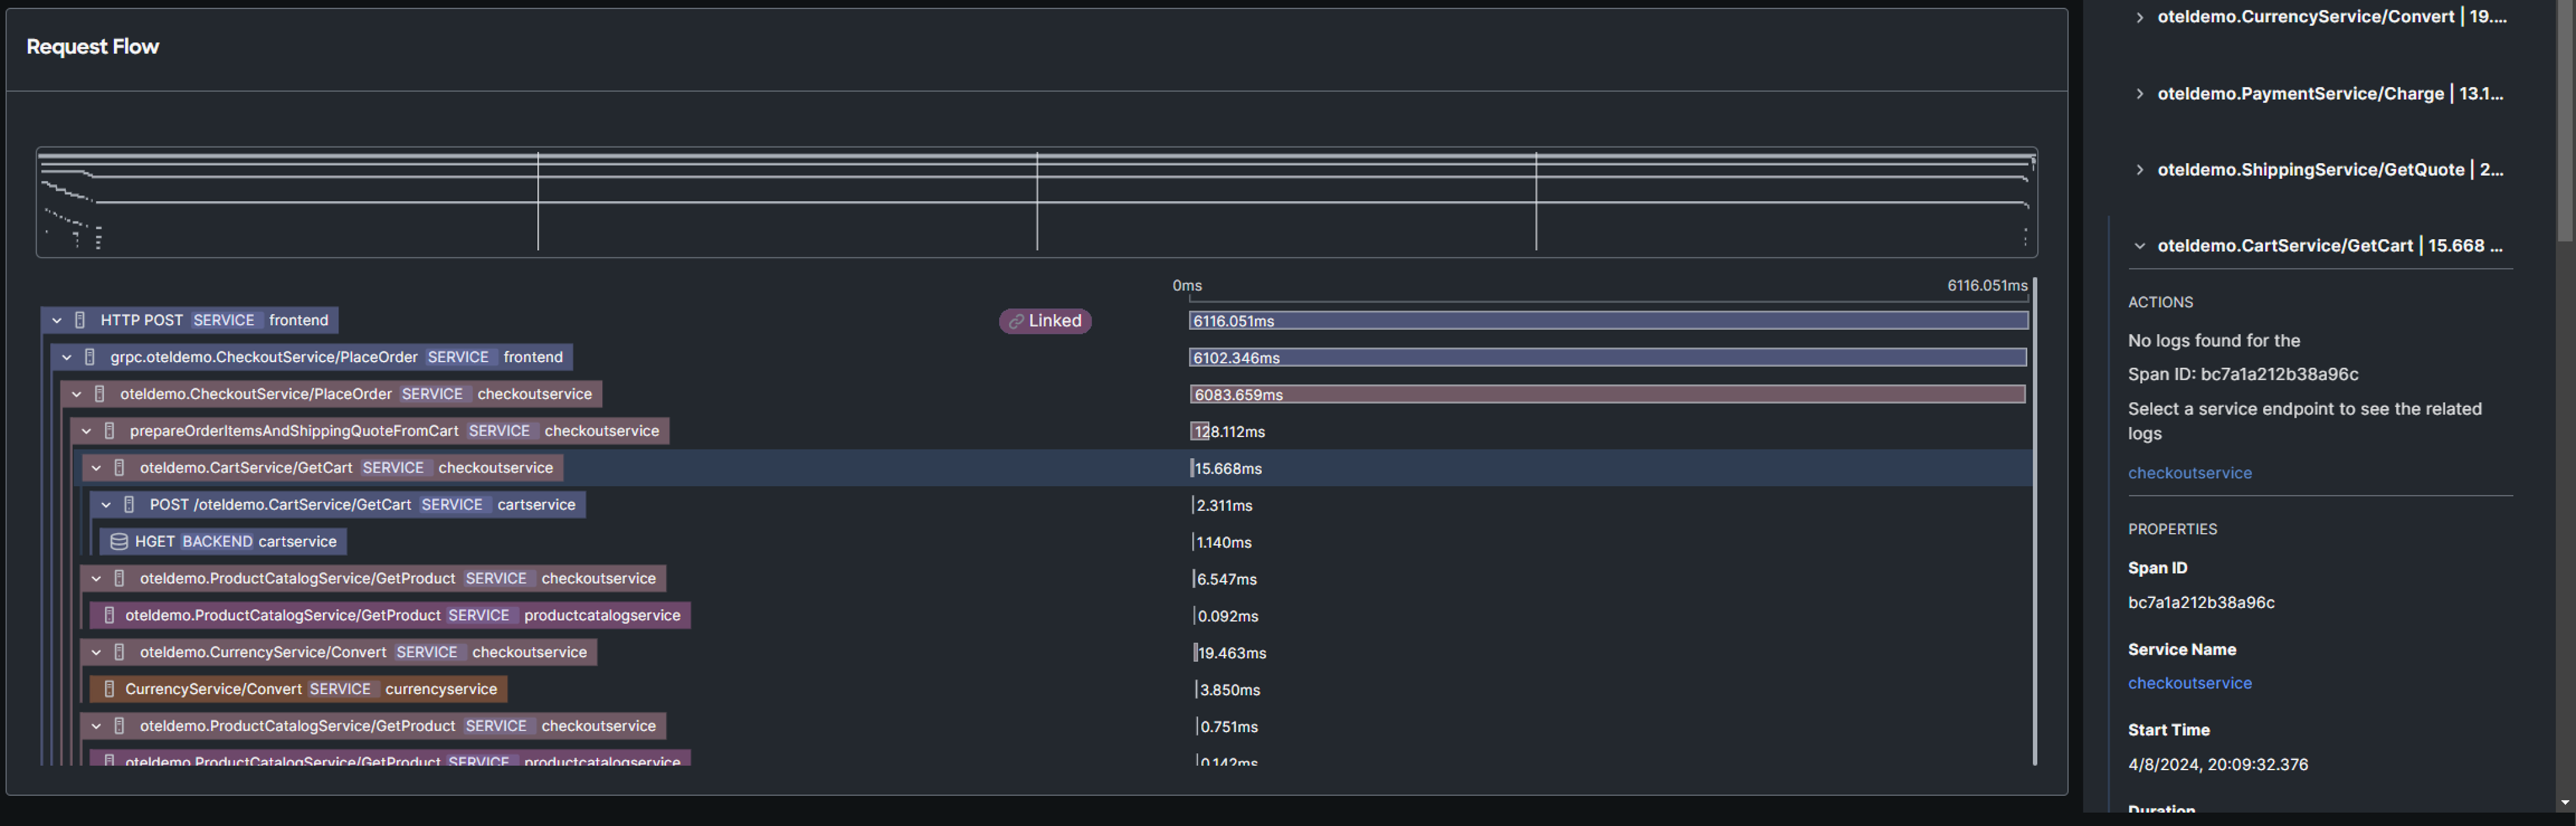
The timeline illustrates the trace flow, showing span and service names within each hierarchy. Clicking a span reveals its Trace properties, OpenTelemetry attributes, and FSO Platform tags in the Properties panel. Purple highlights indicate the selected trace flow and span duration, while red highlights signal an error.
This types of graphs are also referred to as flamegraphs.
Examine the request flow timeline to pinpoint the spans and services with the longest execution times. What insights did you gather?
Select the Related Logs option in the right Trace Overview panel.
If you don’t see the Related Logs option, because you were examining the request flow, navigate back to the traces view, and select the same trace again.
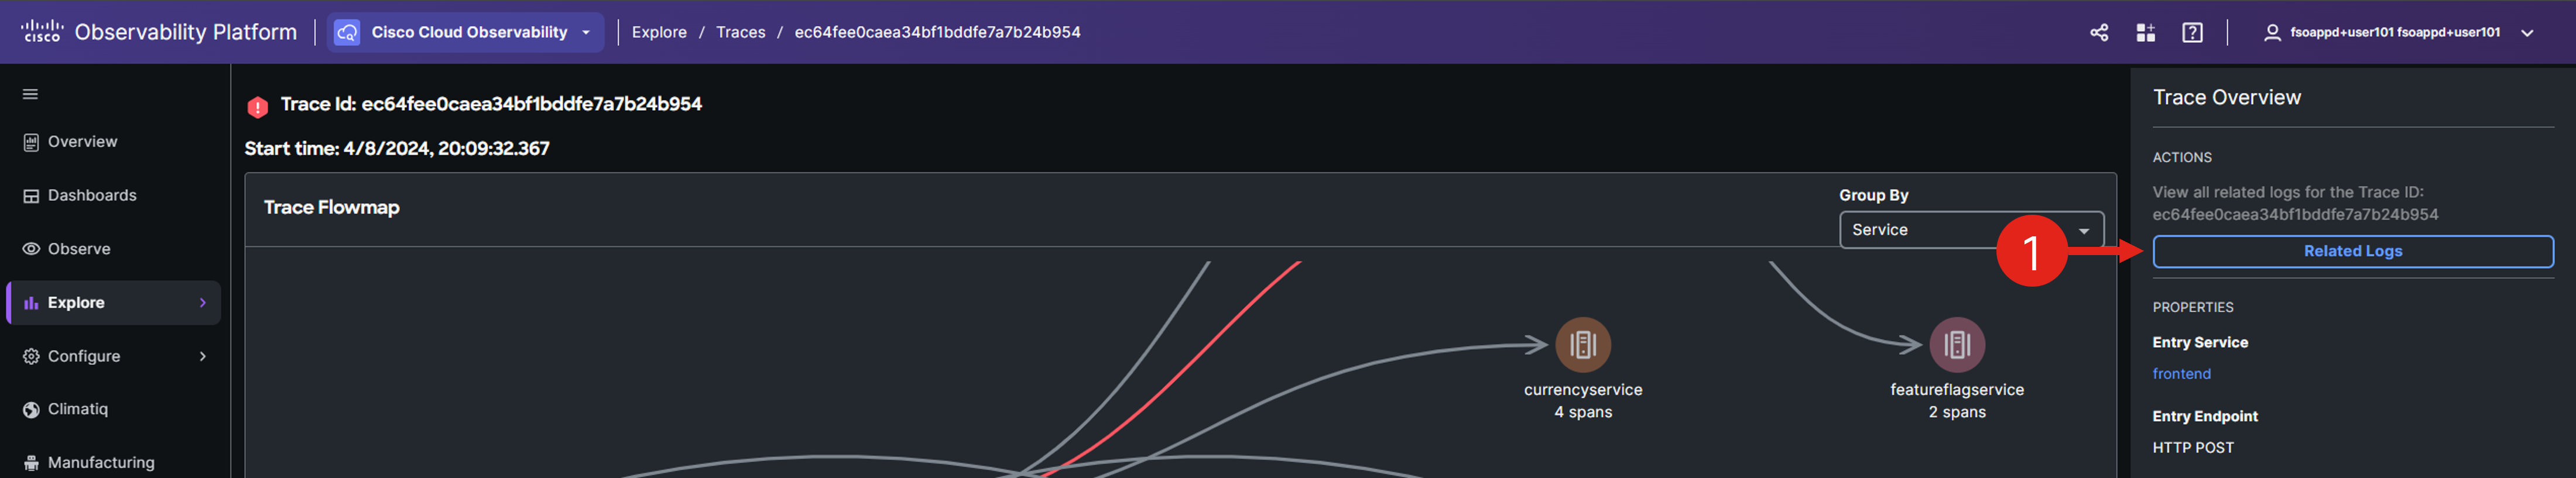
Select an error-indicating log entry from the list and review its details in the right-side panel. Are you able to pinpoint the root cause of the issue?
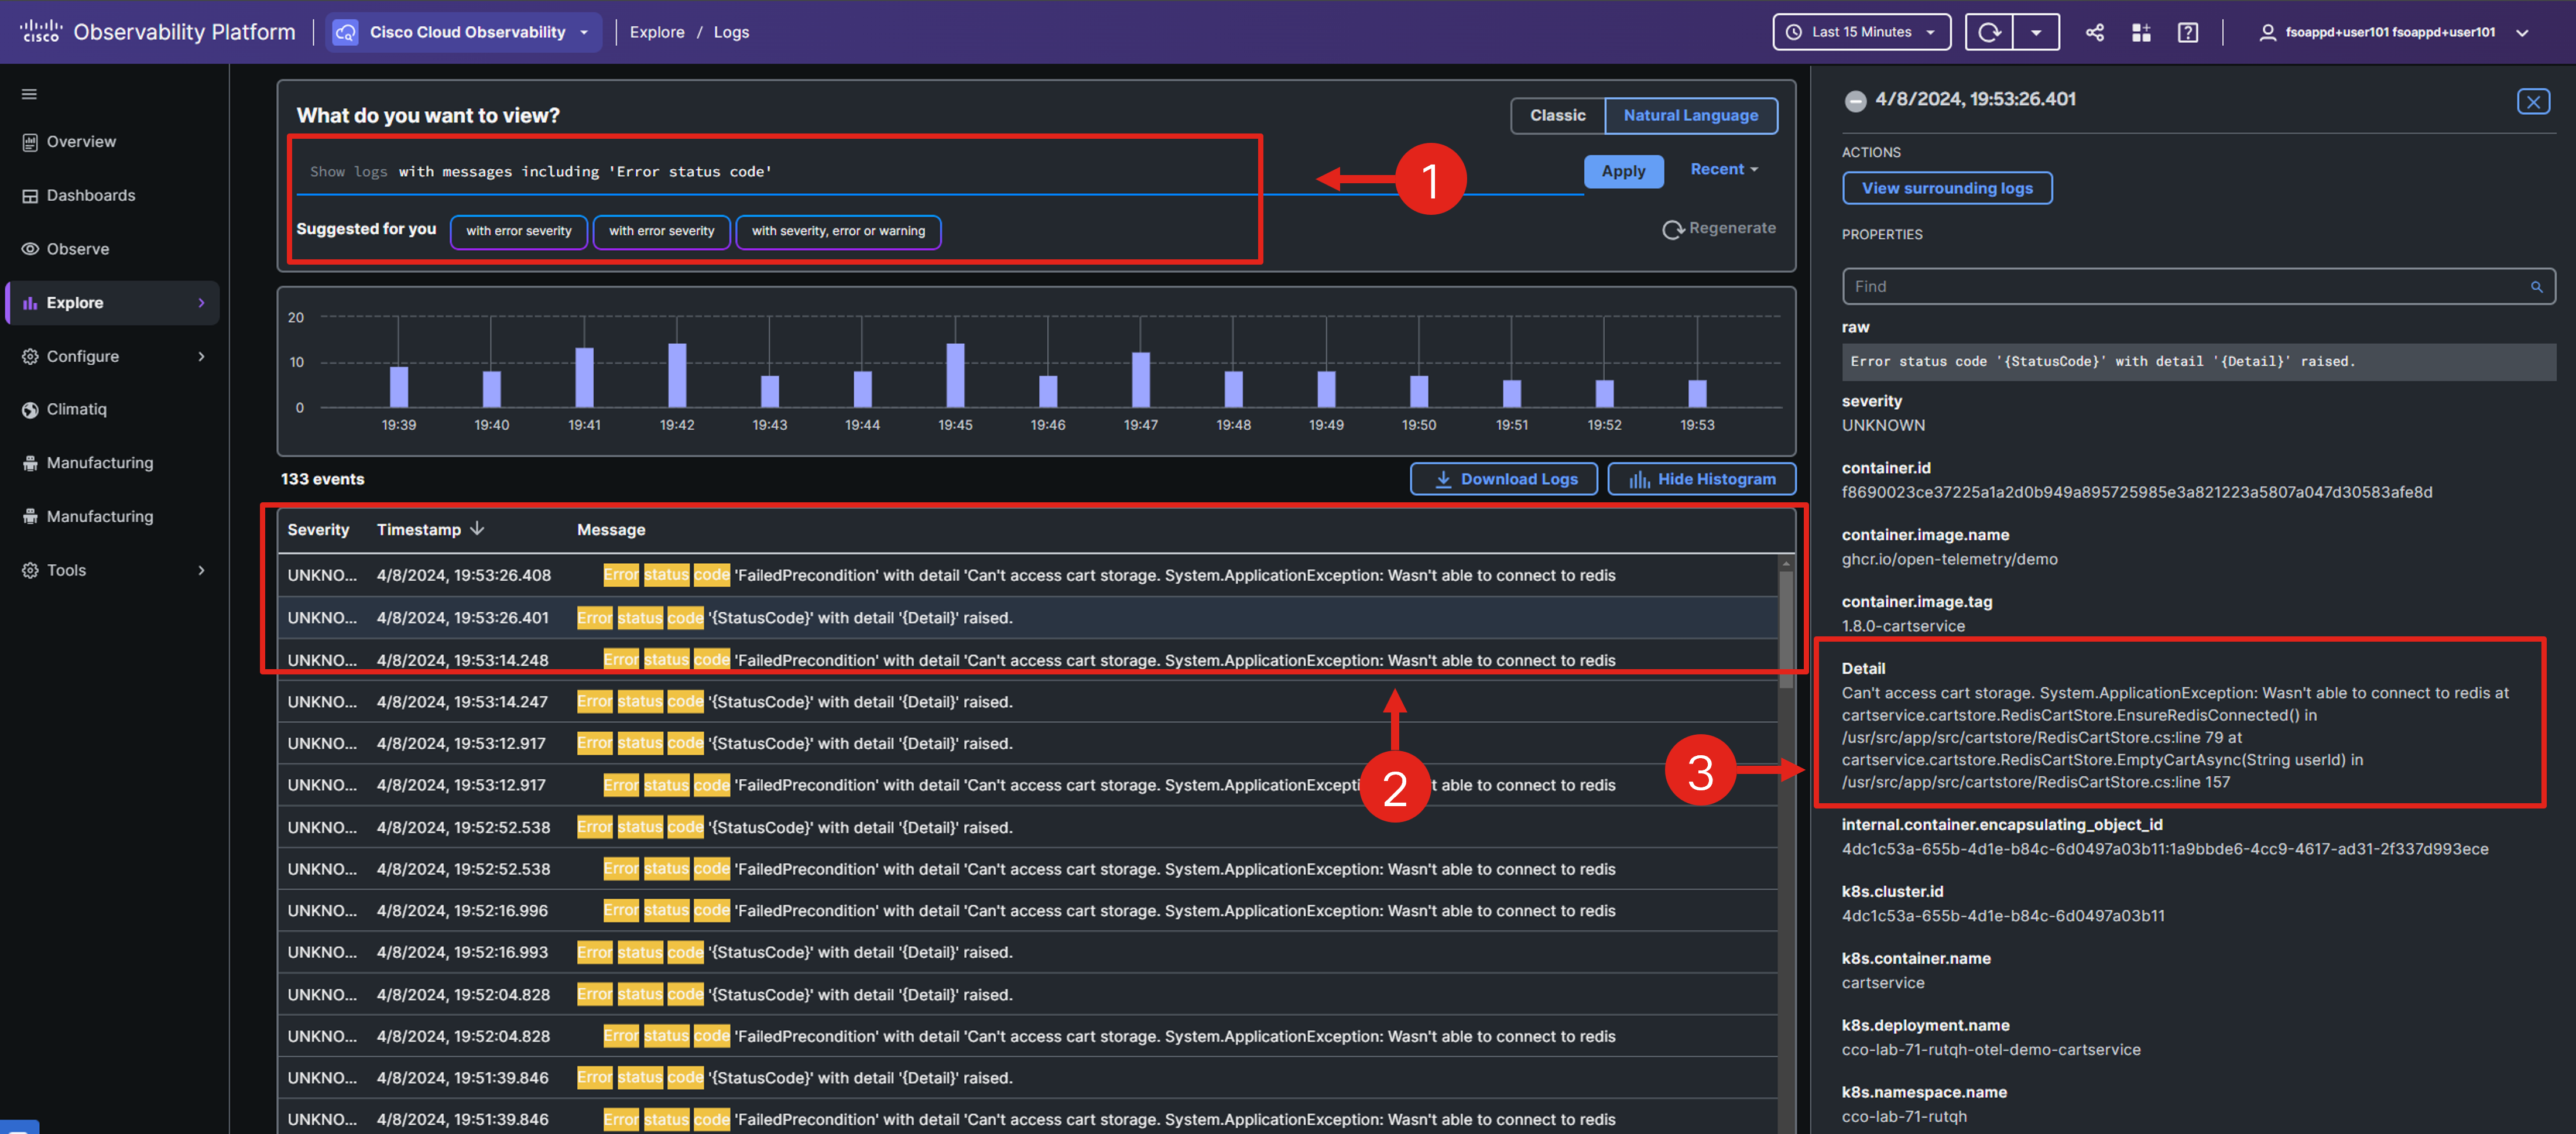
By skillfully navigating the APM domain, you’ve successfully uncovered the root cause of the application issue.
Coming Up Next
In the upcoming section, you’ll continue exploring the APM domain, focusing on observing and configuring Business Transactions (BTs) entity data, while also extracting key business metrics.