Hands-on Deployment
Introduction
Generally there are three configuration workflows in CCO:
- Infrastructure Monitoring
- Kubernetes and App Service Monitoring
- Database Monitoring
To set up your Cisco Cloud Observability, configure Cloud Connections, use OpenTelemetry for instrumentation, and either deploy new OpenTelemetry collectors or configure existing collectors to send data to the Cisco Cloud Observability backend.
Infrastructure Monitoring Installation Overview
Based on your current public cloud deployments, you’ll need to set up a cloud connection to pull data from cloud sources like AWS Cloud Watch, MS Azure Monitor, or Google Cloud Platform. This helps you gain insights into how your cloud infrastructure impacts application performance. To set up your public cloud platform with CCO, you’ll need to supply credentials and any other necessary information for data retrieval.
Additionally you can setup Prometheus or Host Monitoring Data sources.
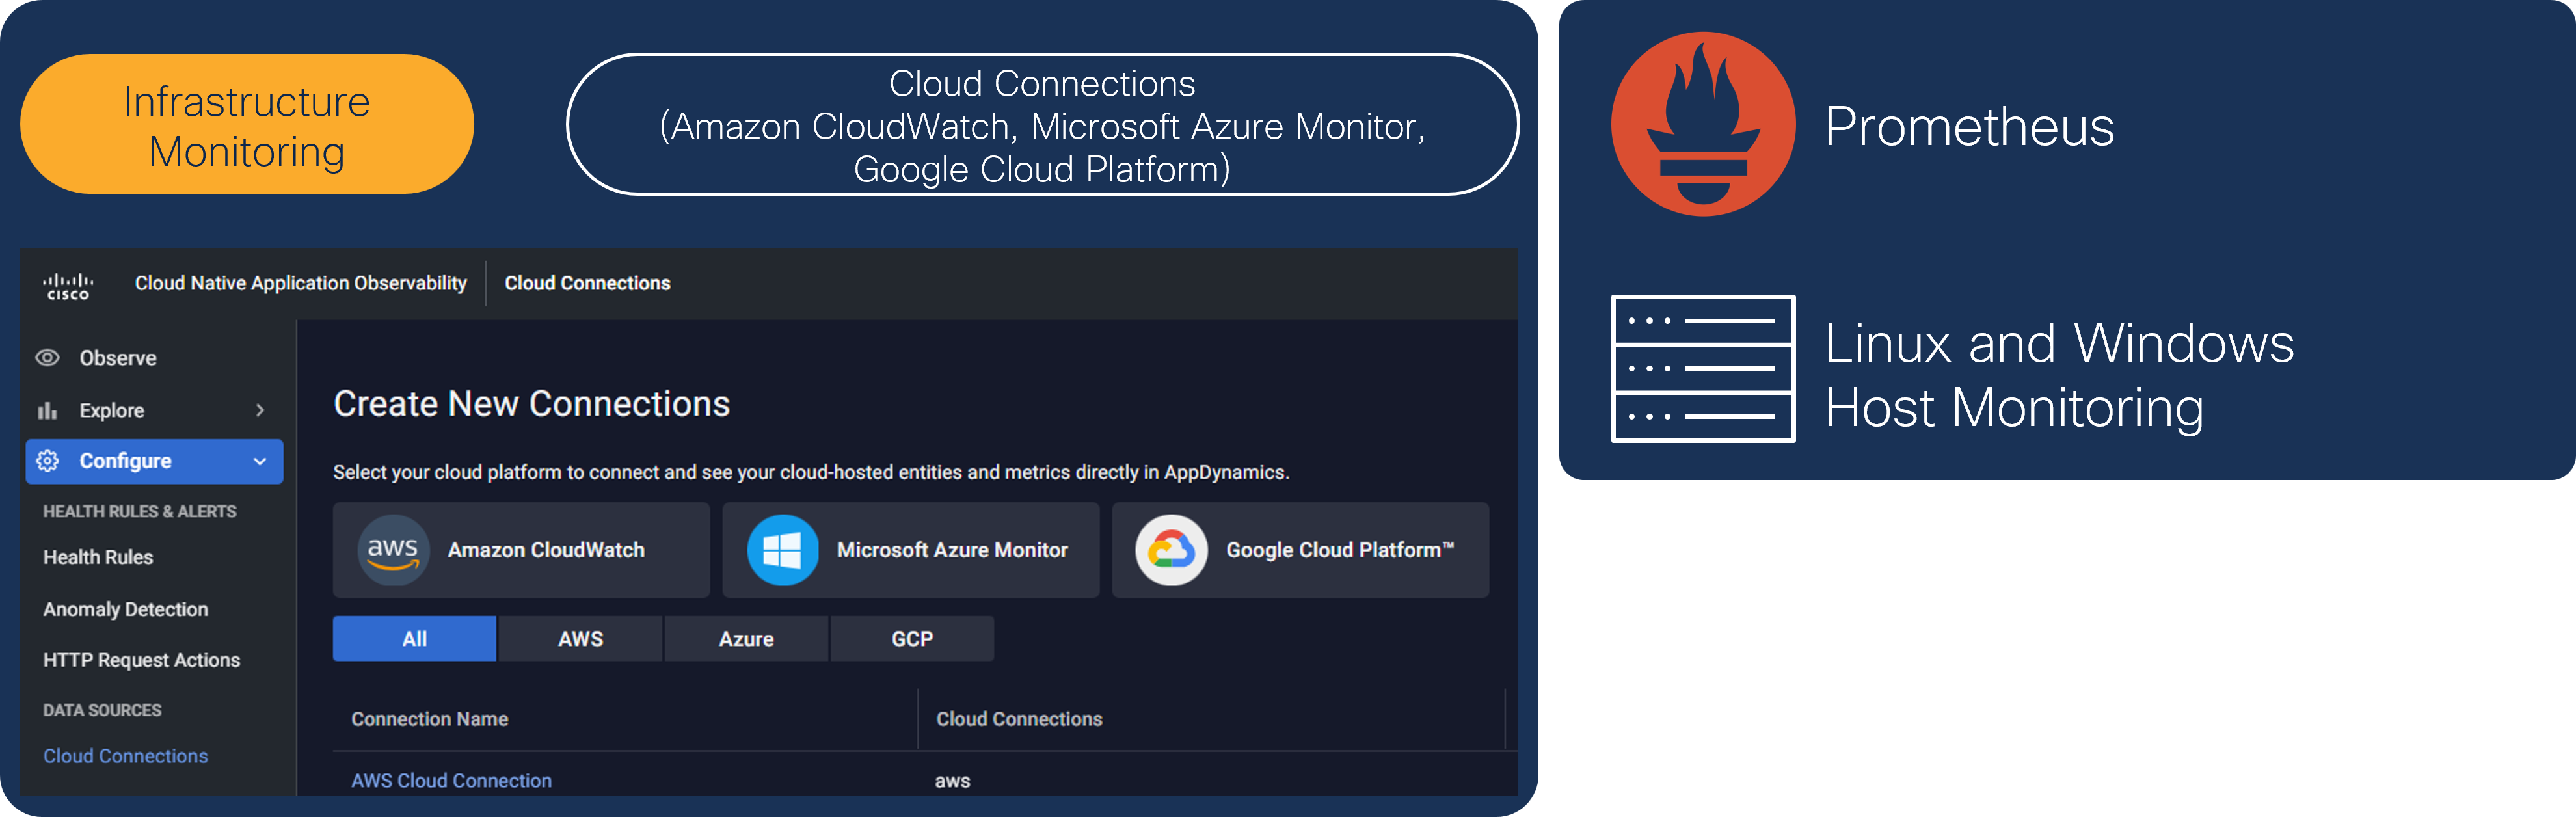
Note: The AWS Cloud Connection has been pre-configured in your lab environment.
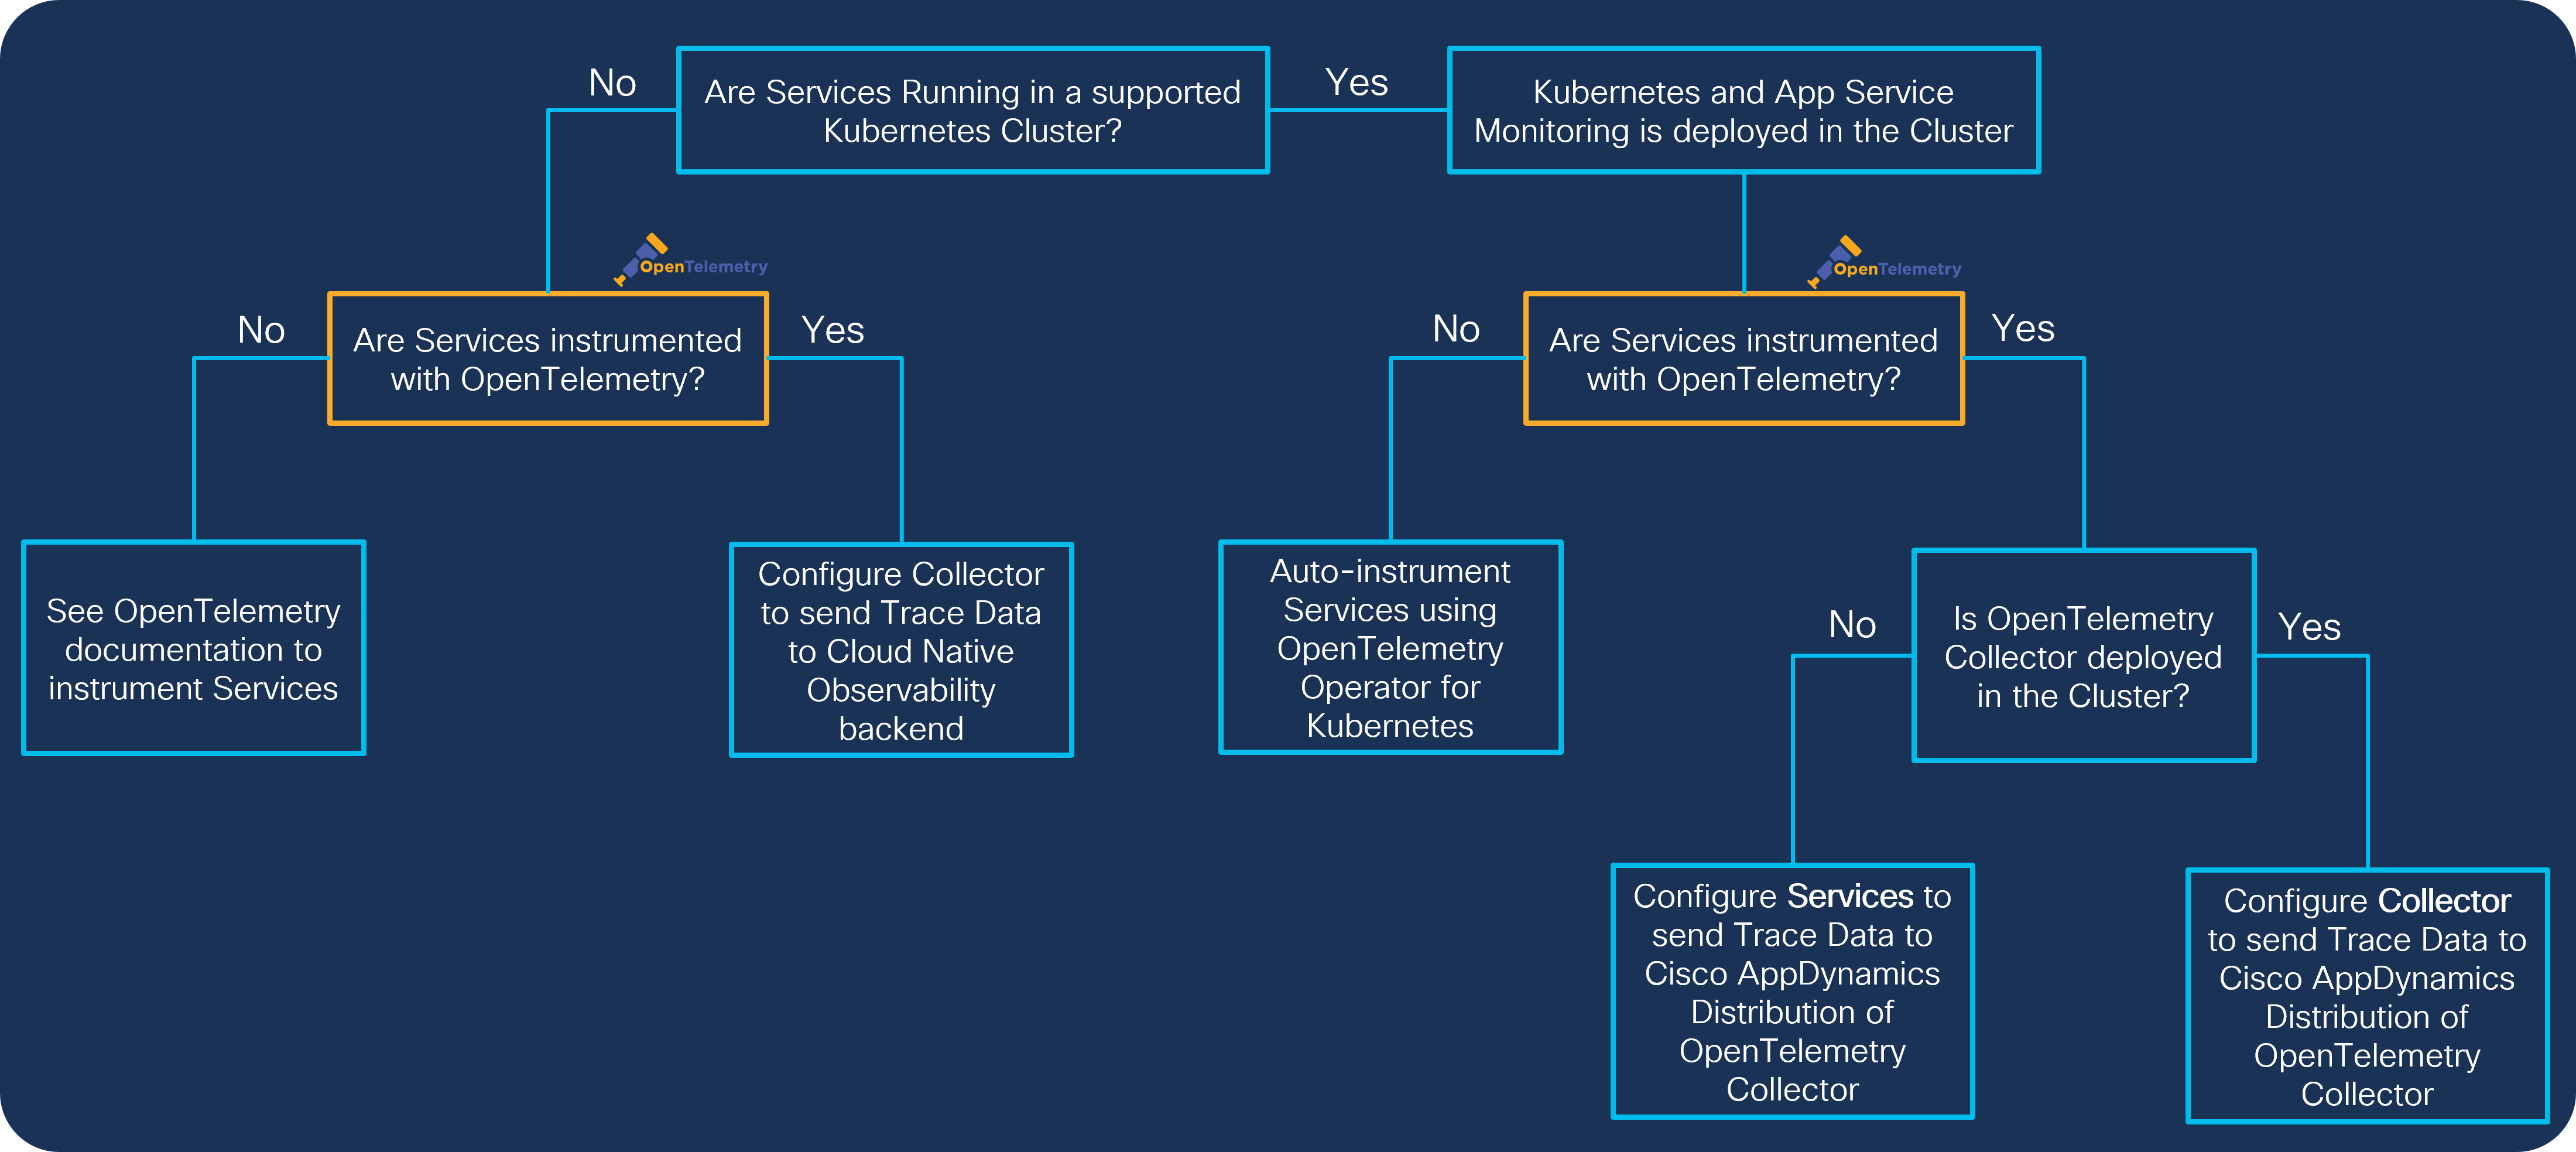
Kubernetes and App Service Installation Overview
Depending on the current application deployment and OpenTelemetry strategy, you can consider two approaches to start monitoring your Kubernetes cluster and app services:
- Services running in a Supported Kubernetes Cluster
- Services running outside of a Supported Kubernetes Cluster
Before you can start monitoring your application services, you need to analyze your environment and define your workflow:
- Install Kubernetes and App Service Monitoring
- Configure Existing OpenTelemetry Collectors to Send Application Data (Optional)
- Configure Services Running Inside a Supported Kubernetes Cluster
- Configure Services Running Outside of a Supported Kubernetes Cluster
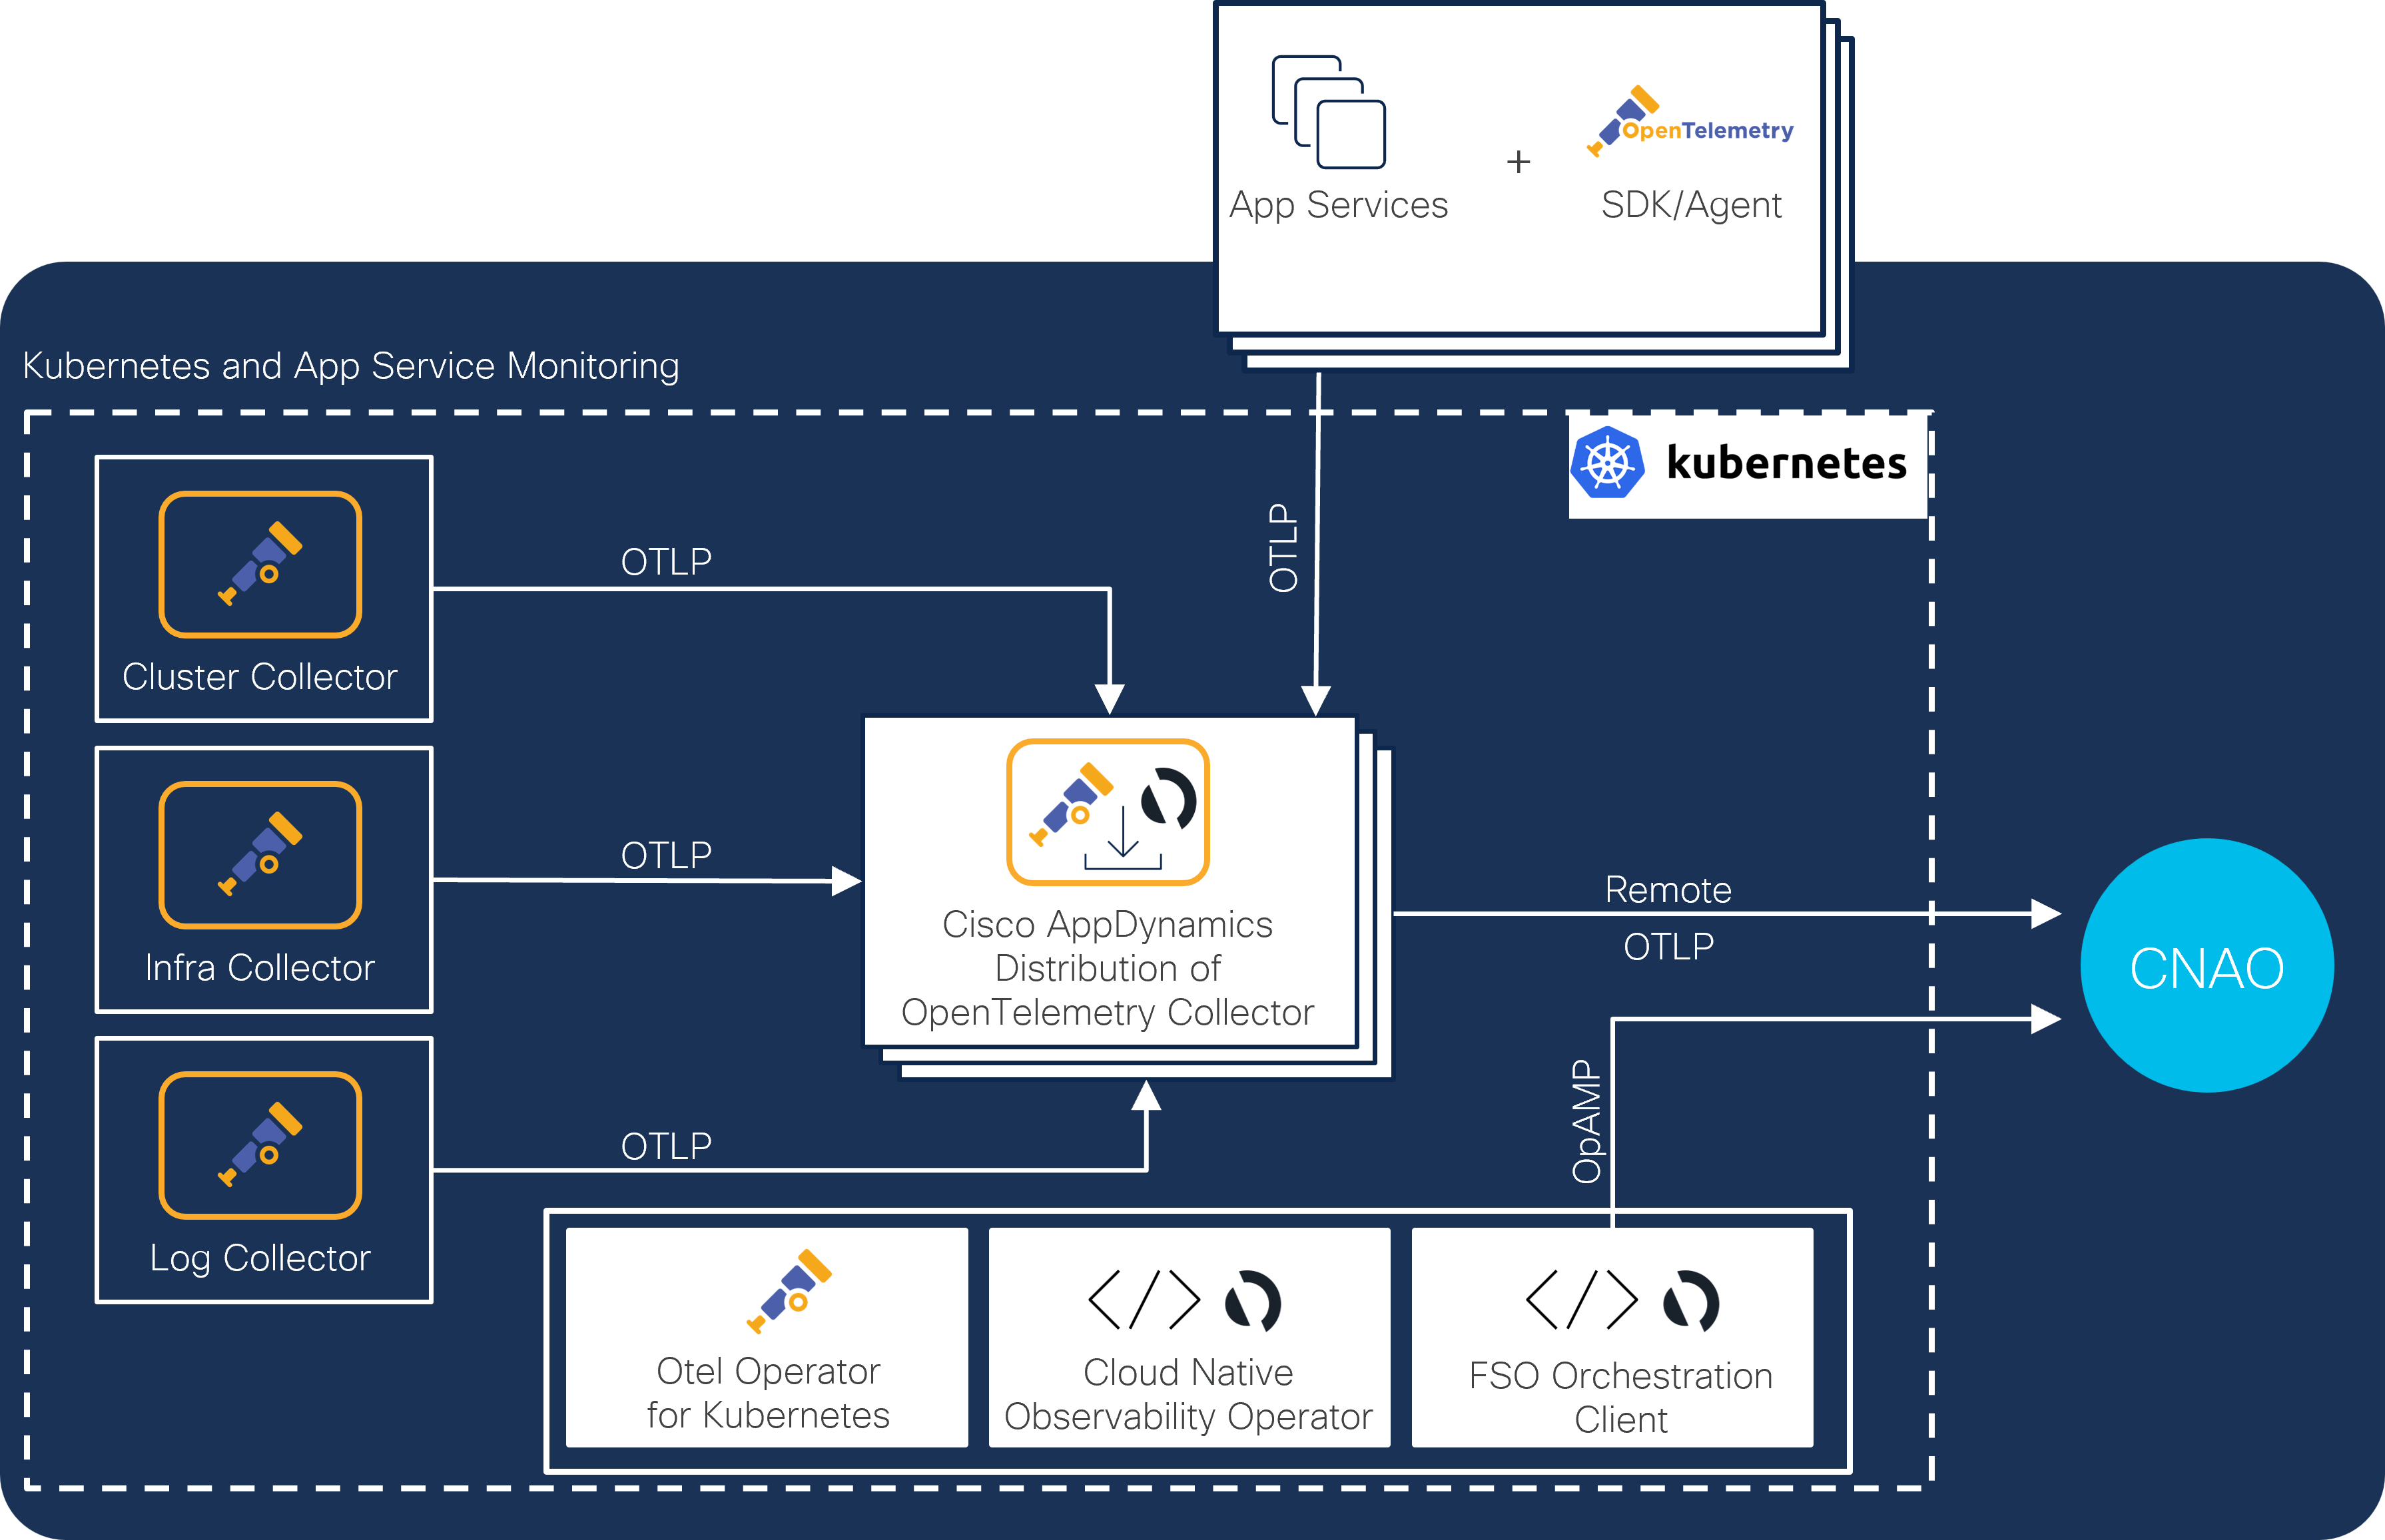
To successfully deploy Kubernetes Observability, you need to install a set of Kubernetes Operators and OpenTelemetry Collectors on your Kubernetes cluster
Coming Up Next
You’ll dive right in by setting up your lab environment and integrating instrumentation into the application.