Explore Kubernetes Infrastructure
Introduction
In the area of cloud-native applications, the Kubernetes cluster serves as a crucial foundation for your deployed services. Familiarizing yourself with CCO’s monitoring capabilities will give you a comprehensive overview of the Kubernetes domain and its associated entities such as namespaces, workloads, pods, and containers. This introduction to monitoring with CCO will guide you through the process of observing the health, performance, and intricacies of your Kubernetes cluster.
You will learn about various entities and their relationships within the Kubernetes domain of the CCO platform.
Navigate the Kubernetes Domain
You will learn to identify and analyze the important metrics, understand the relationships between the various entities, and use this knowledge to maintain a robust and efficient cloud infrastructure. Whether you want to troubleshoot potential issues or optimize resource allocation, CCO will provide you with the insights you need to keep your Kubernetes environment running smoothly.
Navigate to your CCO tenant via the CCO Tenant URL.
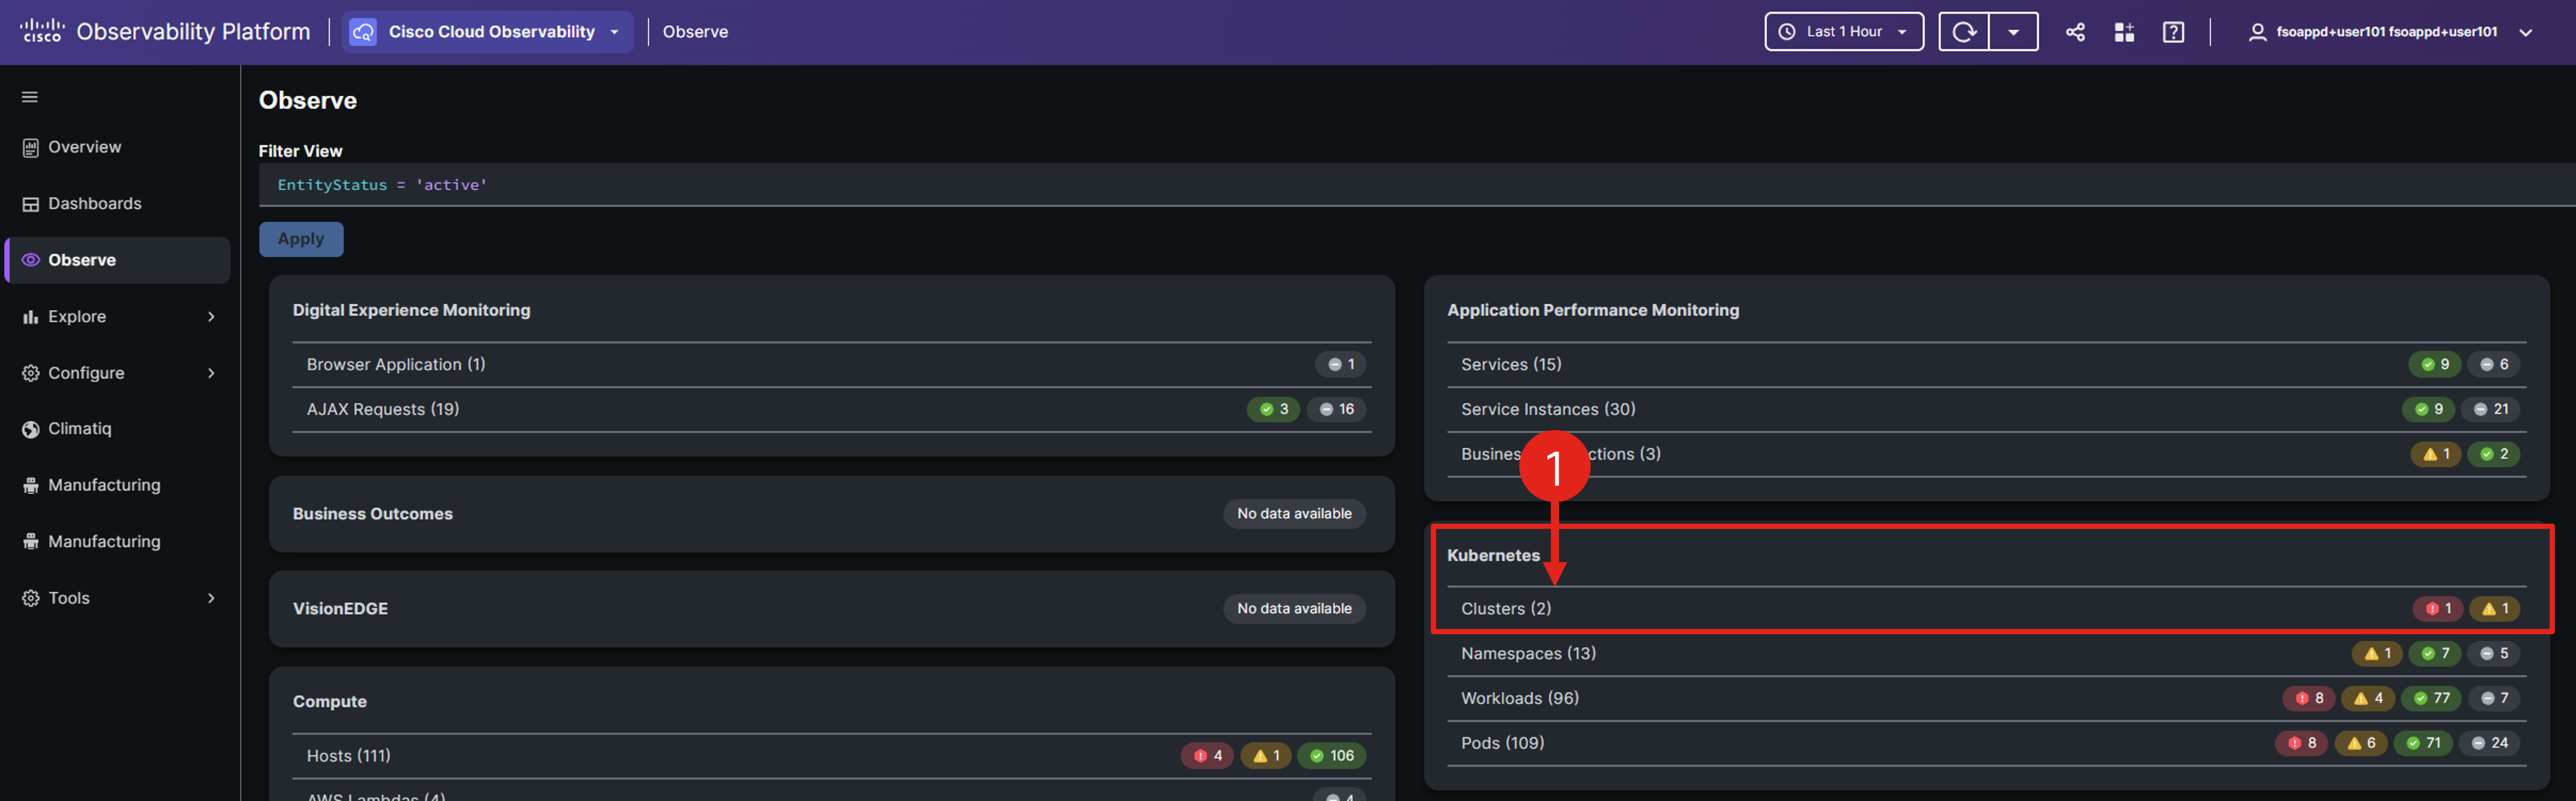
Go to the Observe page and click the Clusters entity within the Kubernetes domain.
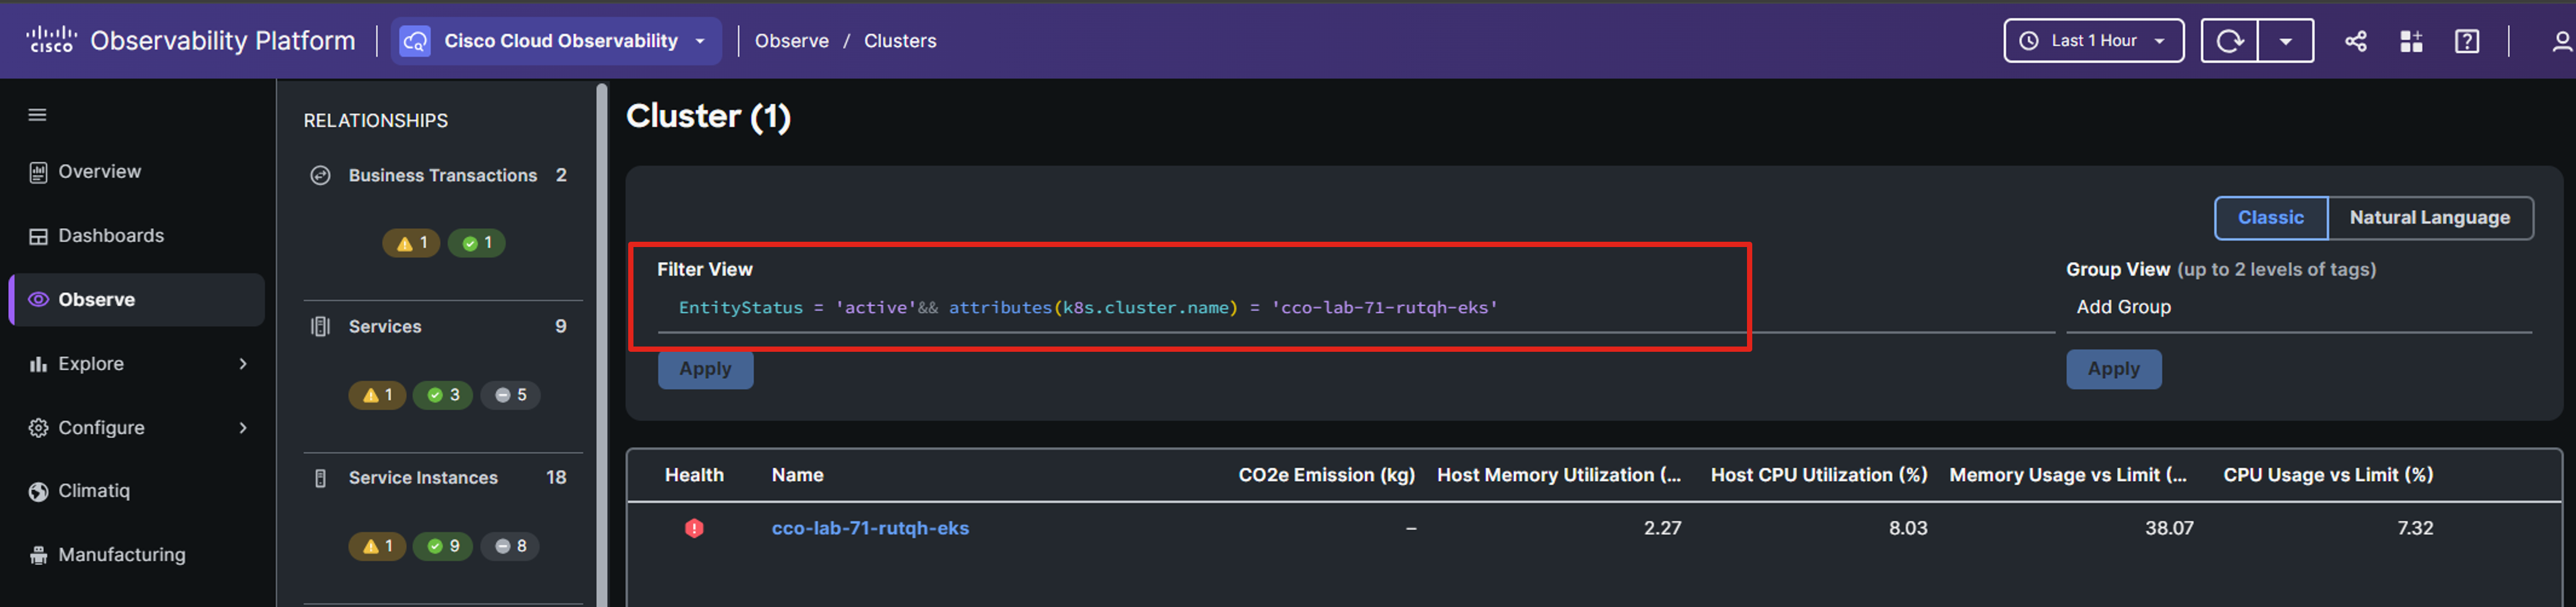
Adjust the view to specifically target your cluster by appending && attributes(k8s.cluster.name) = 'cco_k8s_apm_name' to the existing filter. Ensure you replace cco_k8s_apm_name with the actual environment variable from your Cloud9 environment, which is the name of your EKS Cluster converted to lowercase.
In the Observe and list views, filters allow you to tailor your display to show only the entities and data of interest. Cisco Cloud Observability enables filtering based on:
- Attributes
- EntityStatus
- EntityType
- Id
- Tags
- Metrics
Learn more about filters by navigating here.
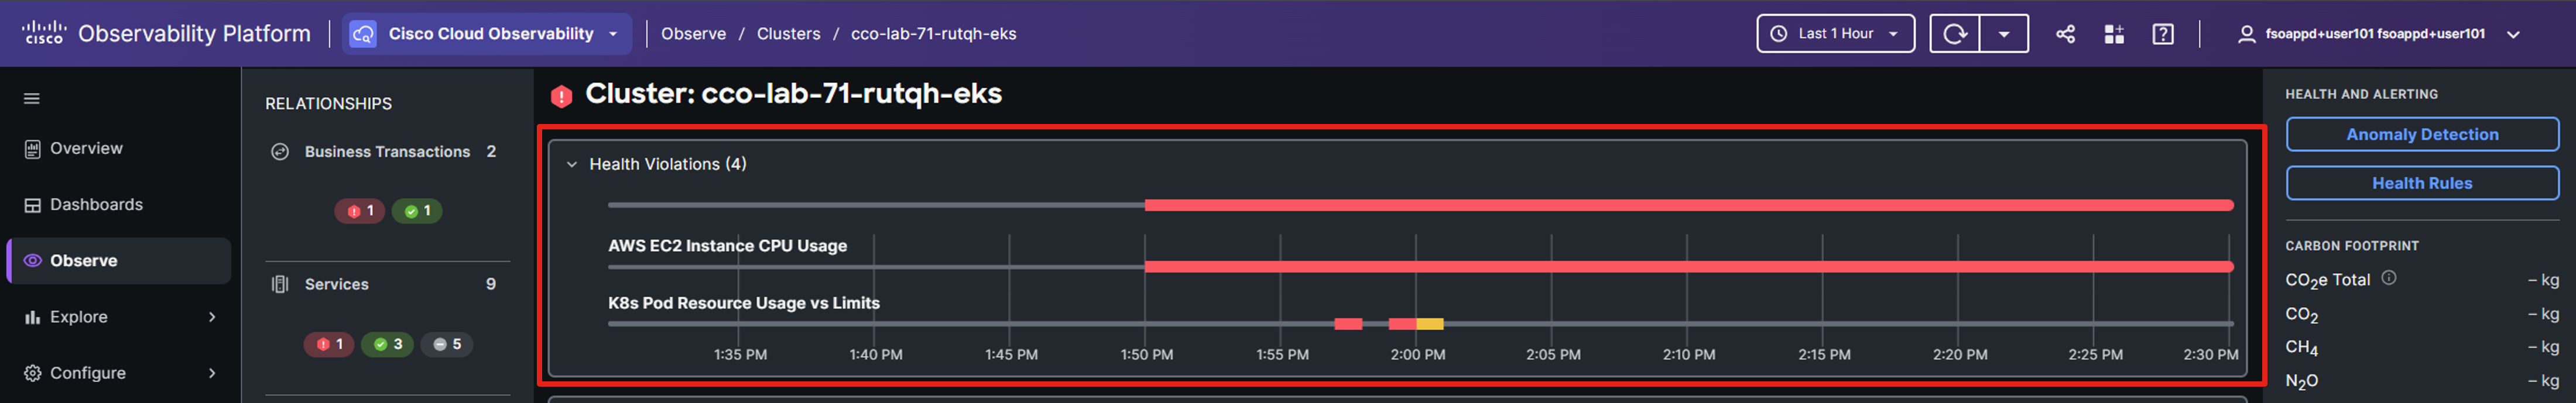
Click on your cluster’s name to view a detailed overview of its performance.
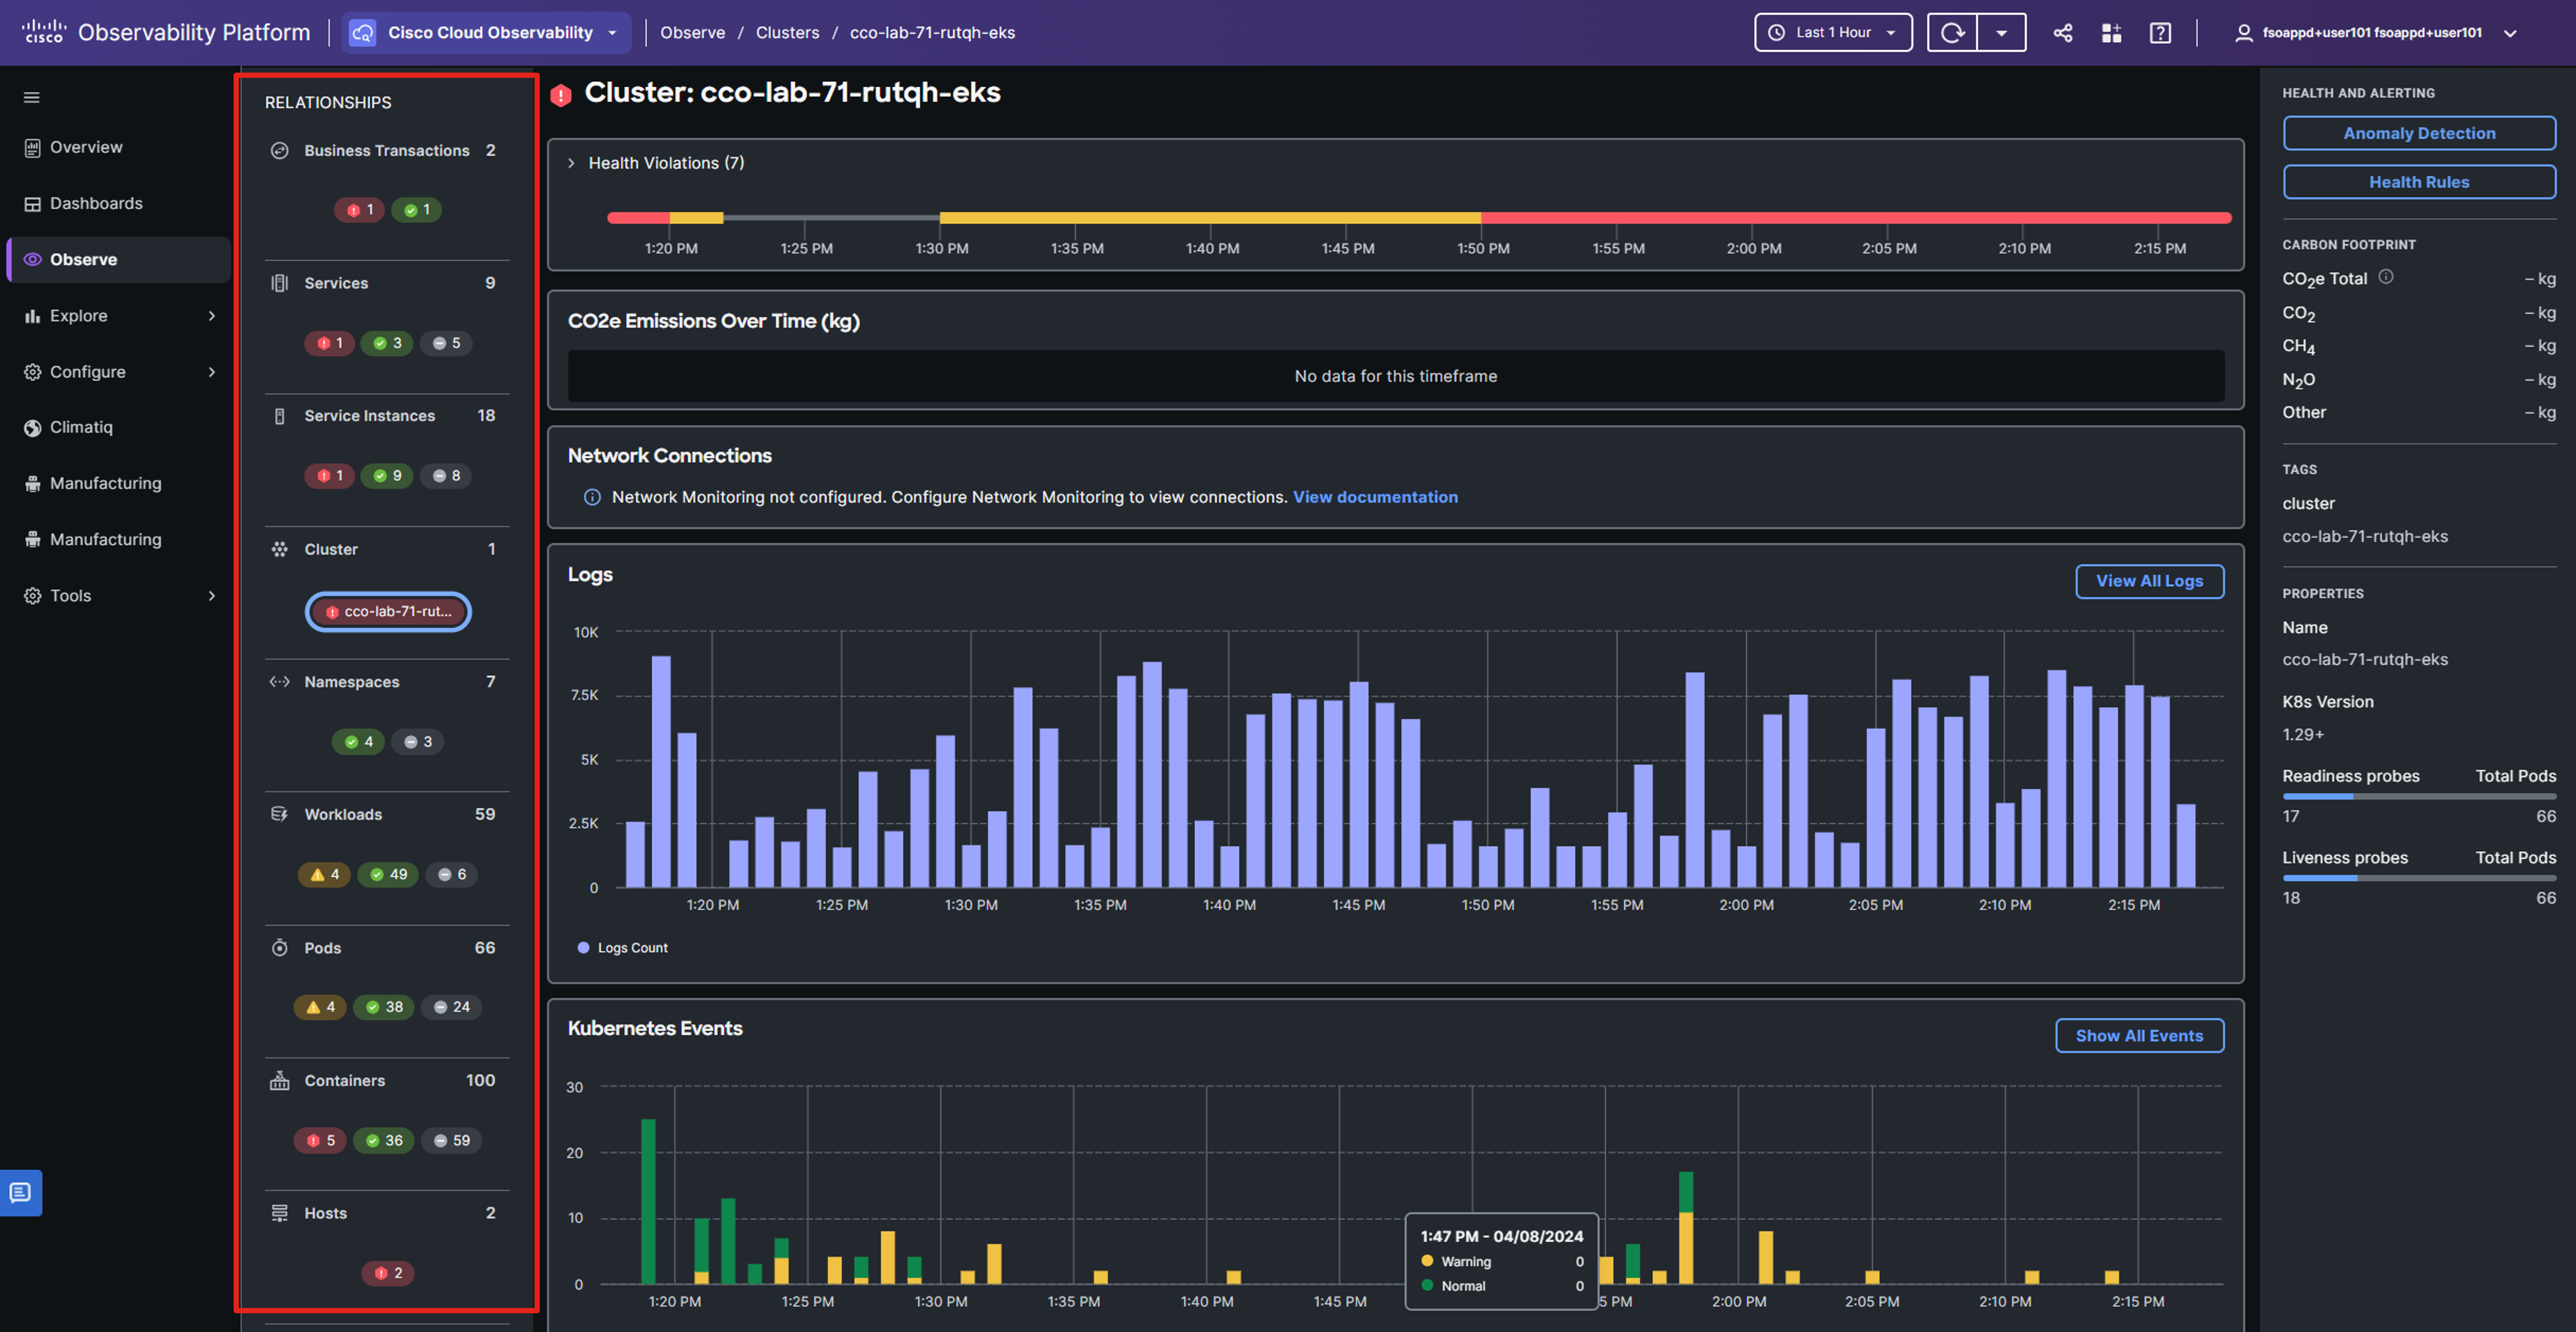
The RELATIONSHIPS panel on the left provides a gateway to all entities associated with your Kubernetes domain.
The central panel presents a detailed snapshot of the cluster’s current performance.
The right-hand menu consolidates data from various views, offering a quick summary of cluster health and essential properties like tags, names, and versions.
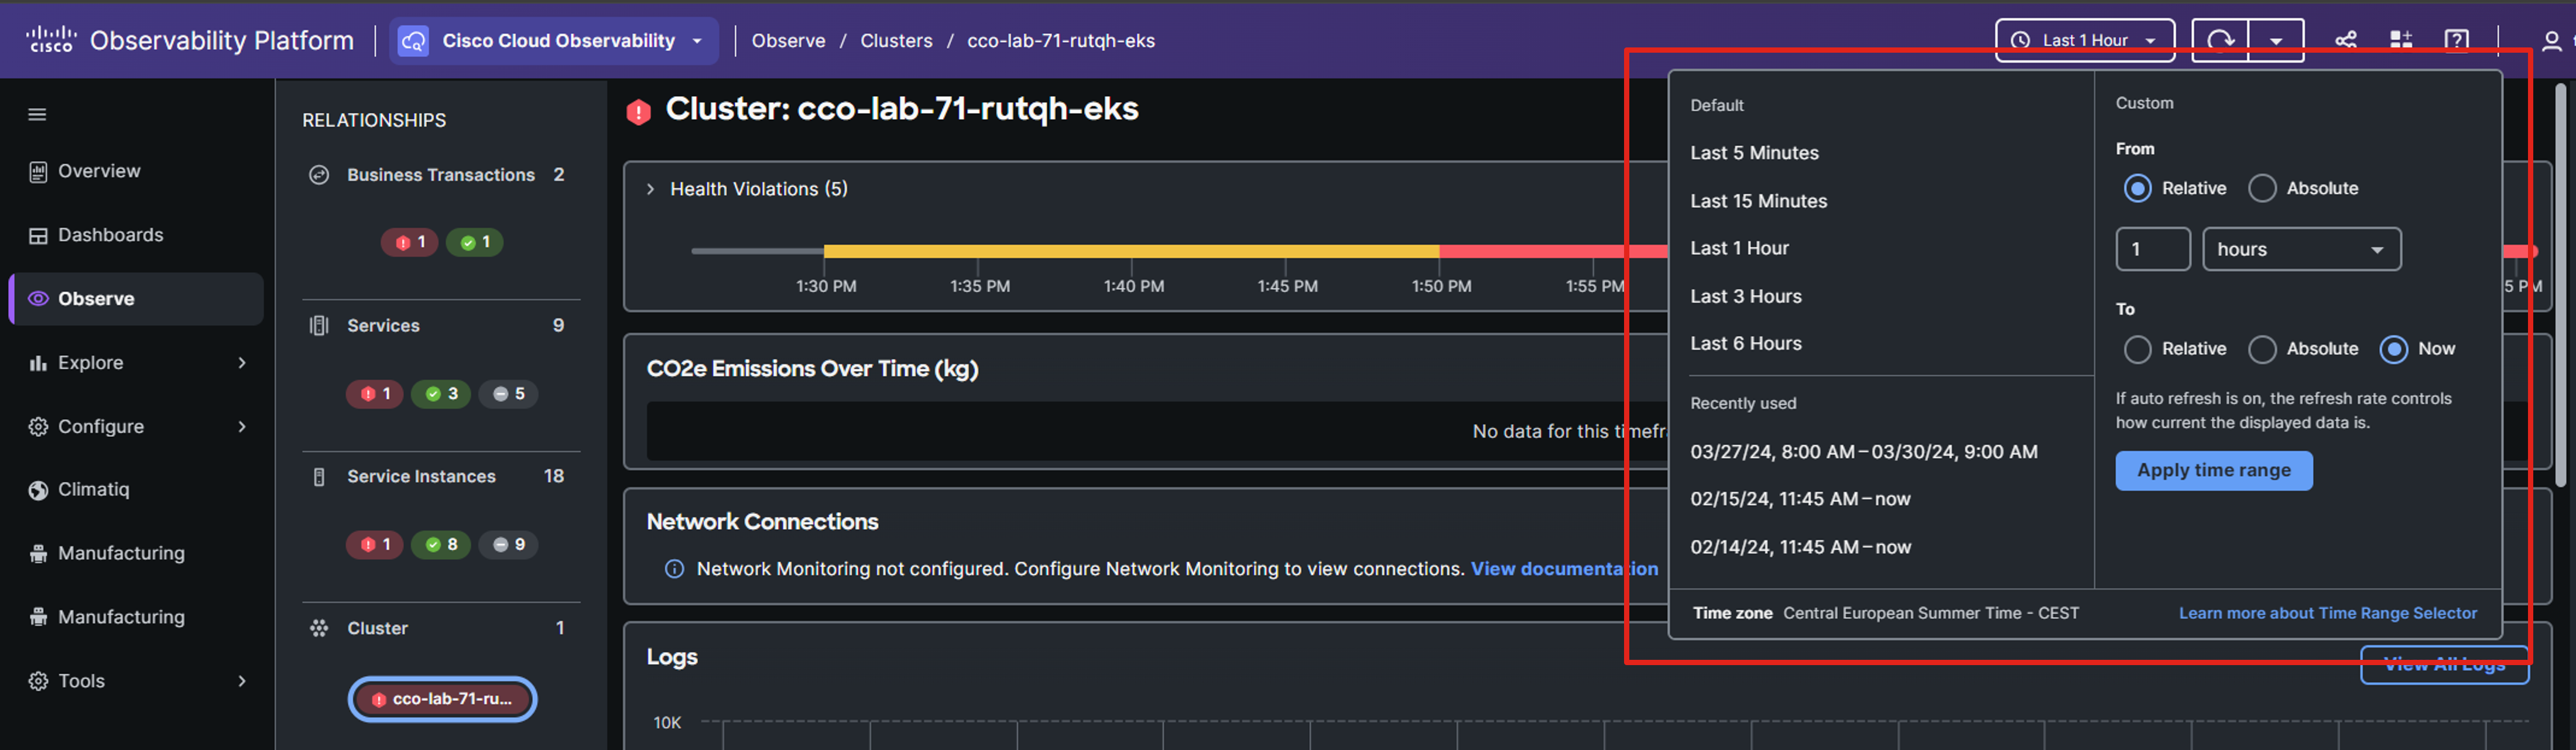
You can adjust the time range in the upper-right corner, which will update the data displayed in the views to reflect the chosen time period.
Health Violation Timeline
Health rules enable you to define parameters that represent normal or expected operational conditions in your environment, such as CPU Utilization for a host. By default, certain health rules are pre-configured for monitored domains and entities.
A health rule violation happens when the set critical or warning conditions of that rule are met. You can see the details of these violations for a specific entity or any health rule in the Health Violation Timeline.
Note: Your screen might look a bit different from the image shown above.
Learn more about Health Rules by navigating here.
Namespaces Entity
The Namespaces page serves as a hub for both real-time and historical performance data of Kubernetes namespaces, offering:
- Namespace-level metrics.
- Aggregated metrics summaries from workloads, PVCs, pods, and containers within each namespace.
- Summaries of changes in Kubernetes Configurations for each namespace.
- Kubernetes Events linked to each namespace.
In the RELATIONSHIP panel select the Namespace entity.
Only the namespaces deployed to your Kubernetes cluster are shown here, because the relationship between the entities is pertained.
Click the namespace to which your app was deployed.
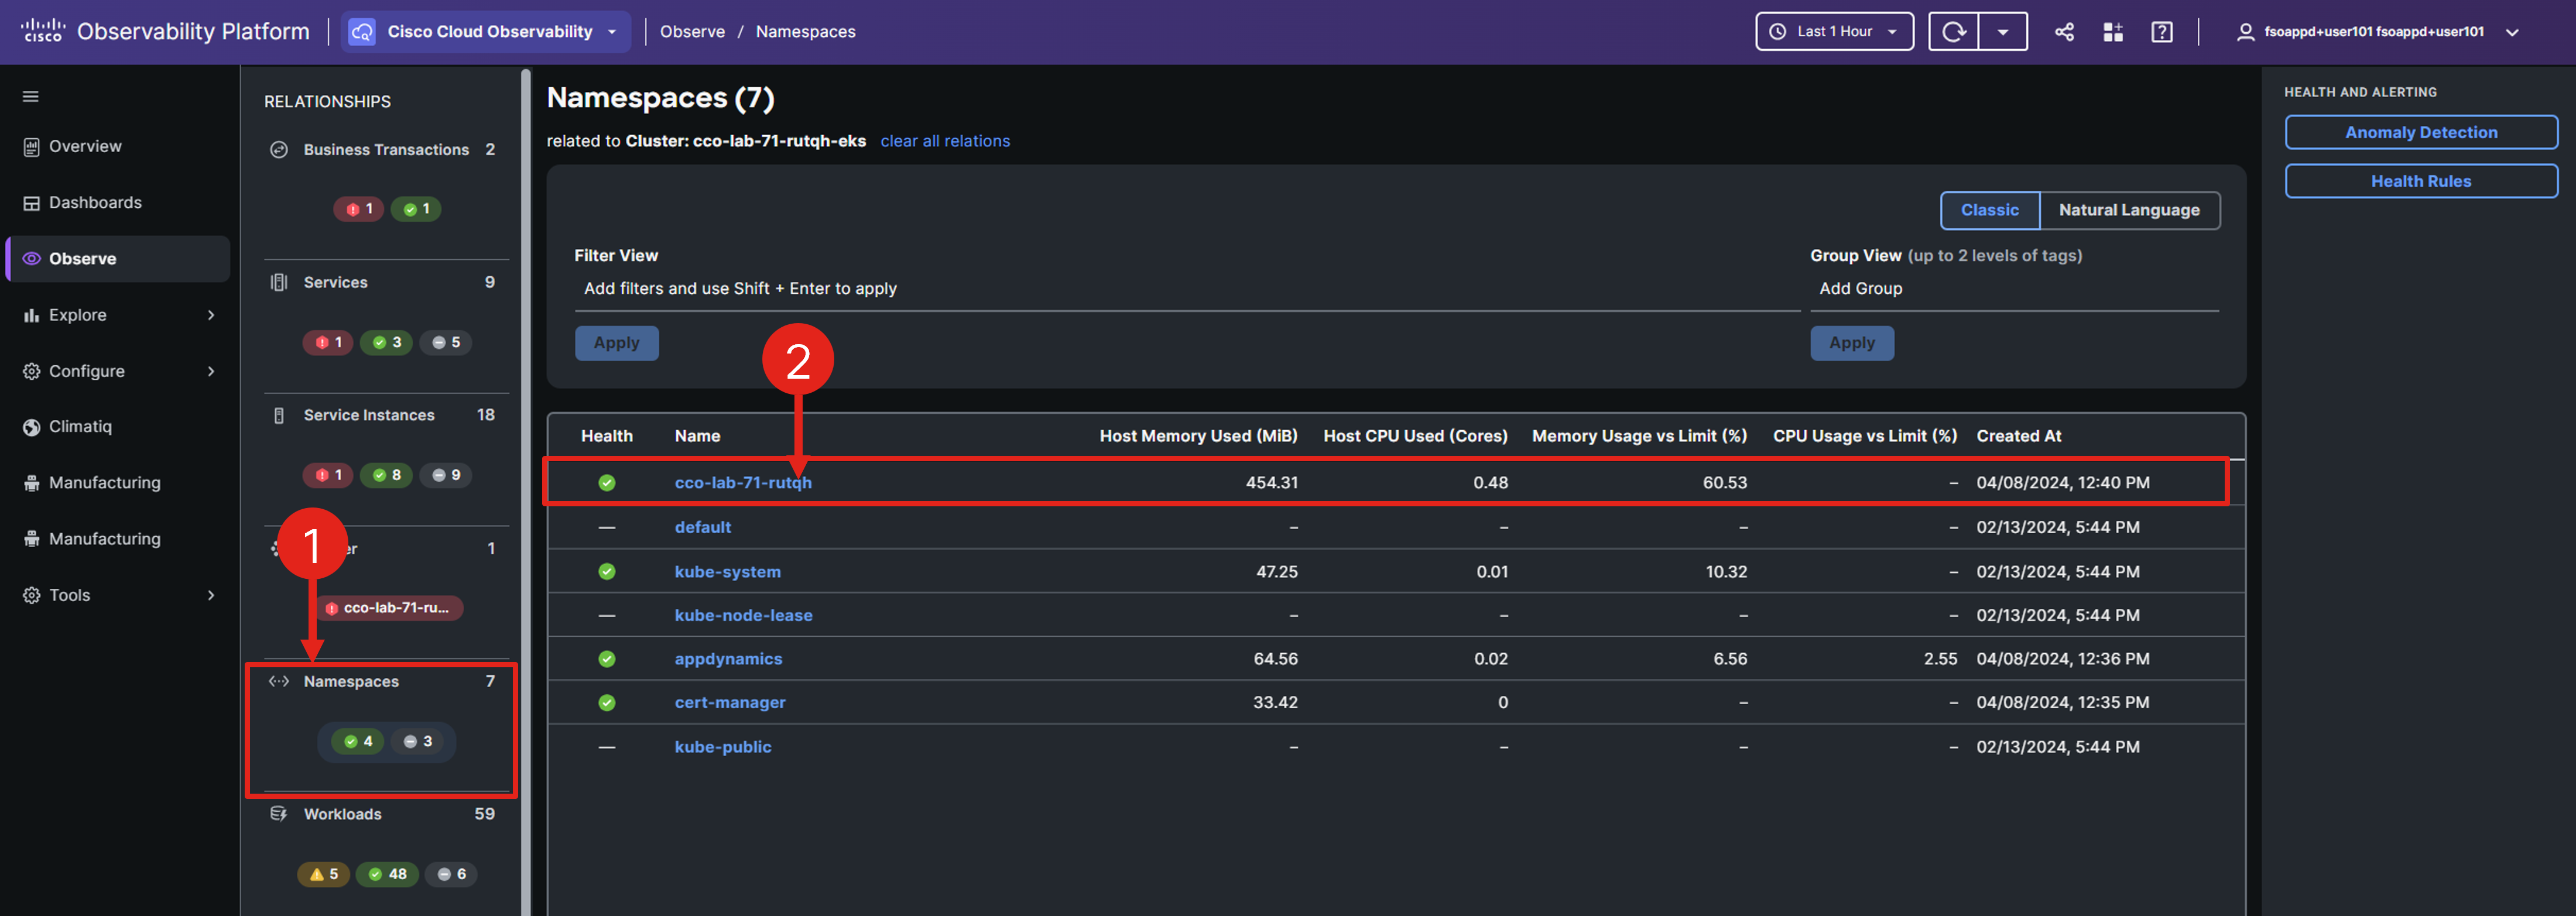
The namespace view expands to show the overall performance of the components and entities associated with the Kubernetes namespace.
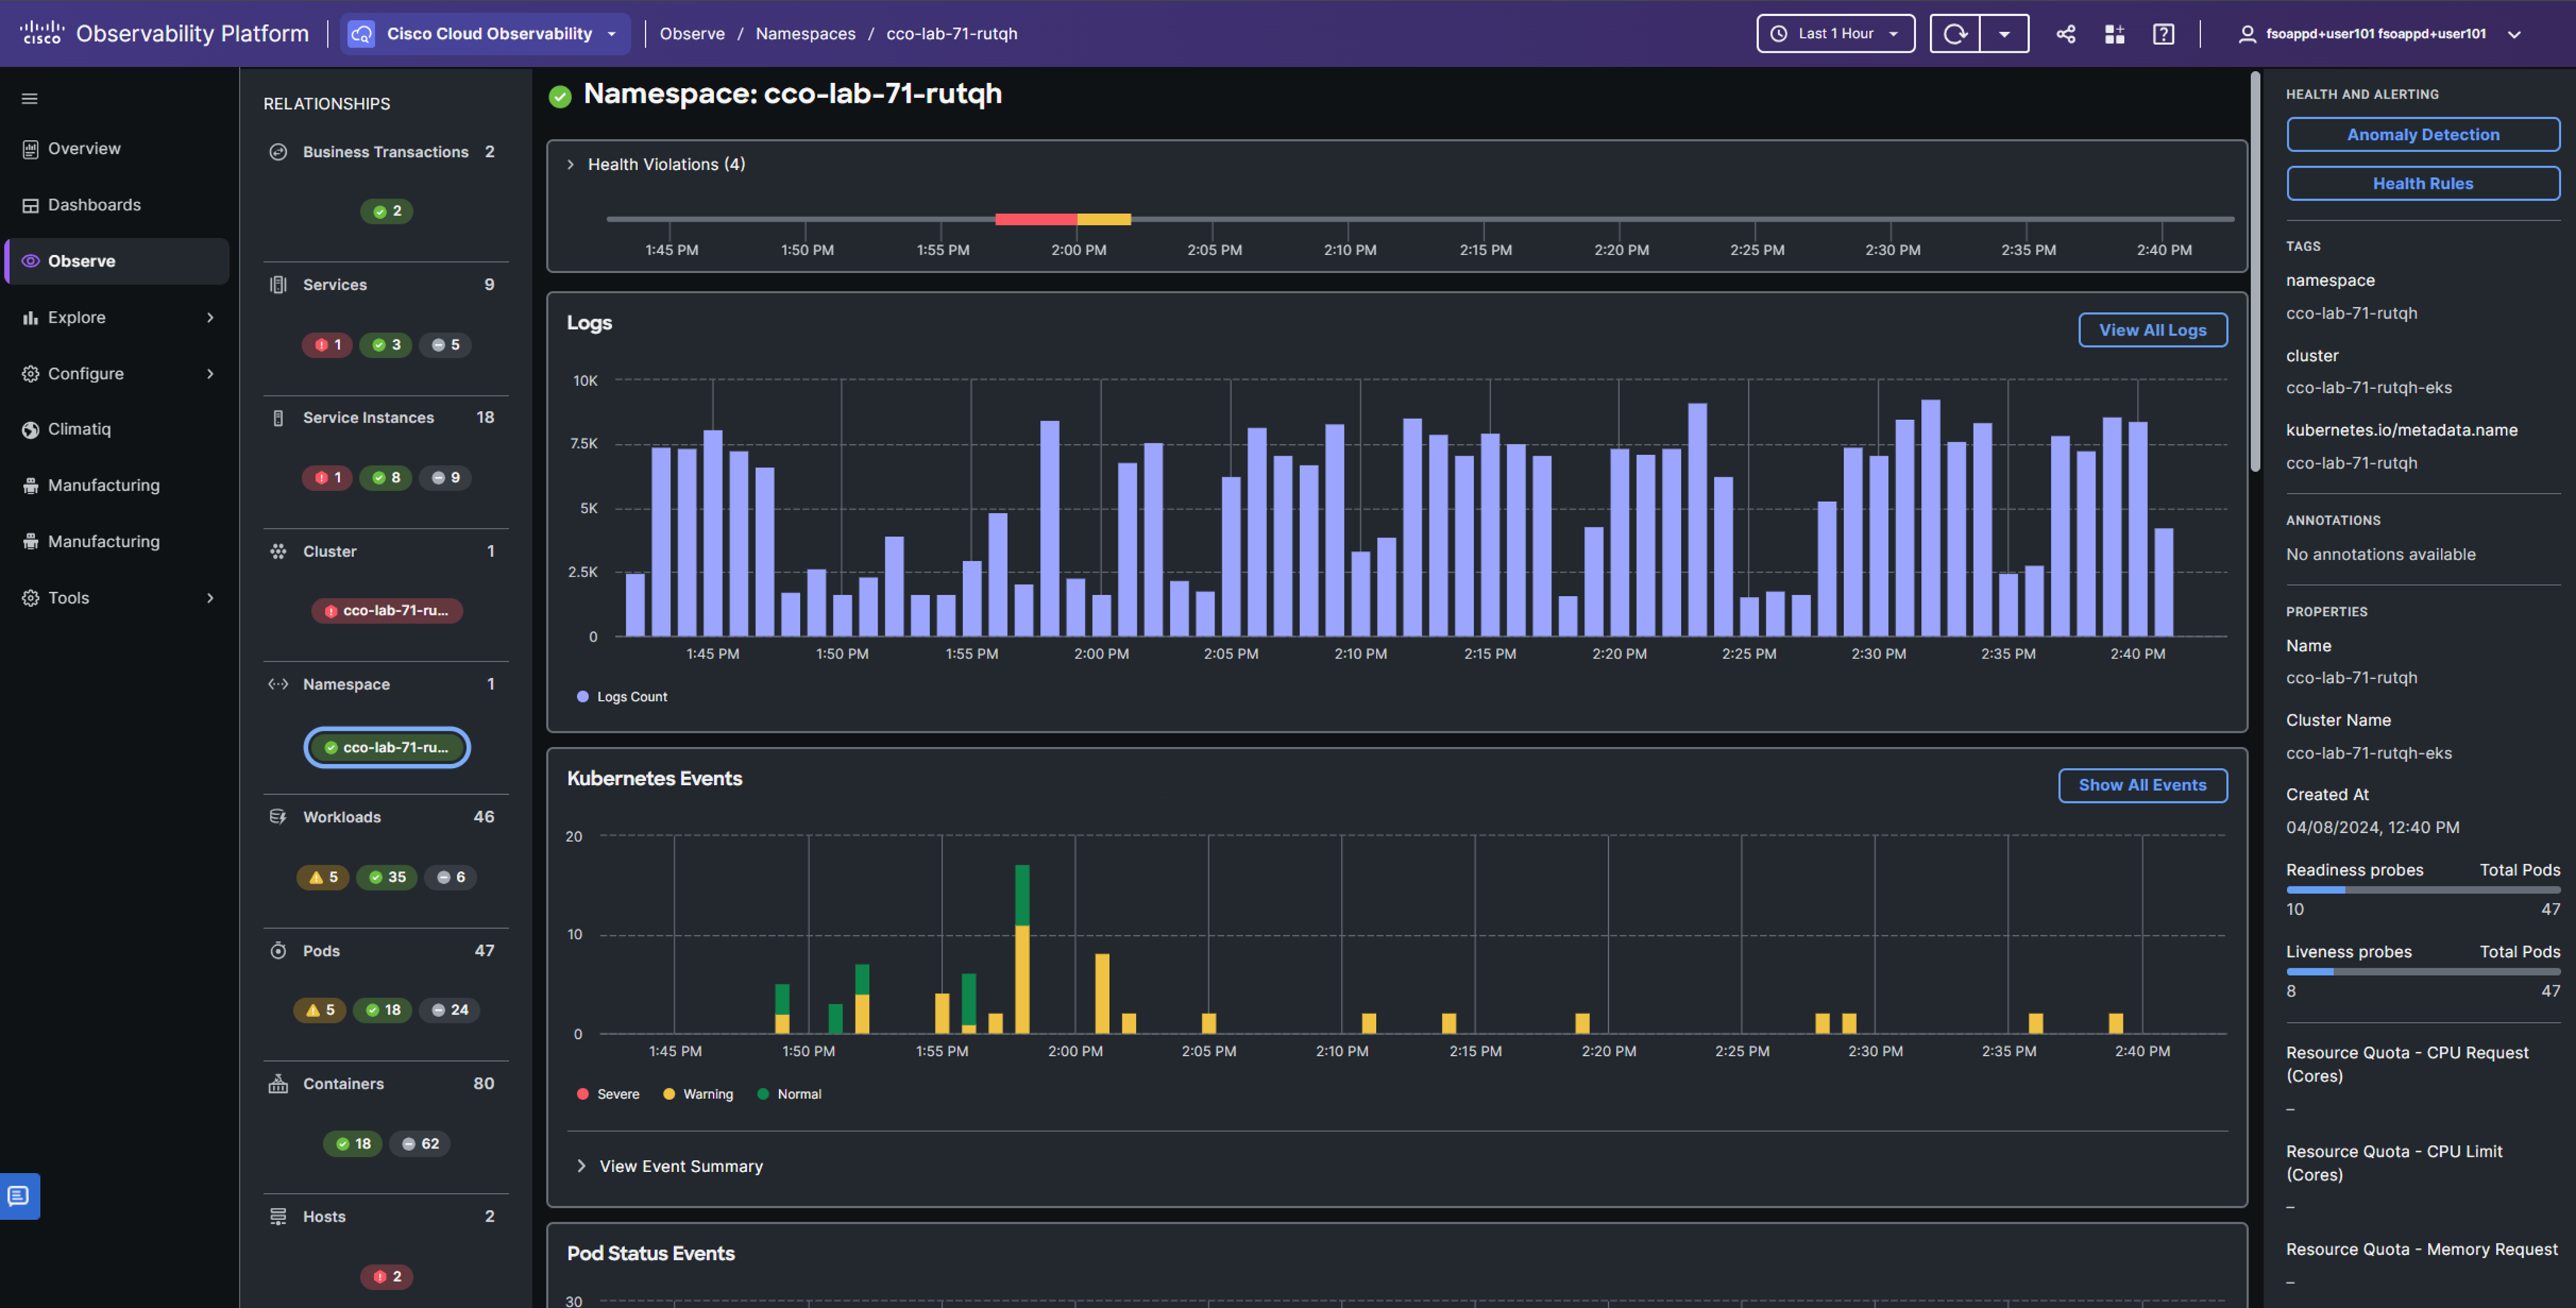
Learn more about Namespaces entity by navigating here.
Logs
Logs are crucial for troubleshooting as they provide detailed insights into actions, errors, warnings, unexpected conditions, and various other events.
In the namespace entity center pane, scroll to the Logs window and click View All Logs to view the logs associated with the current Kubernetes namespace.
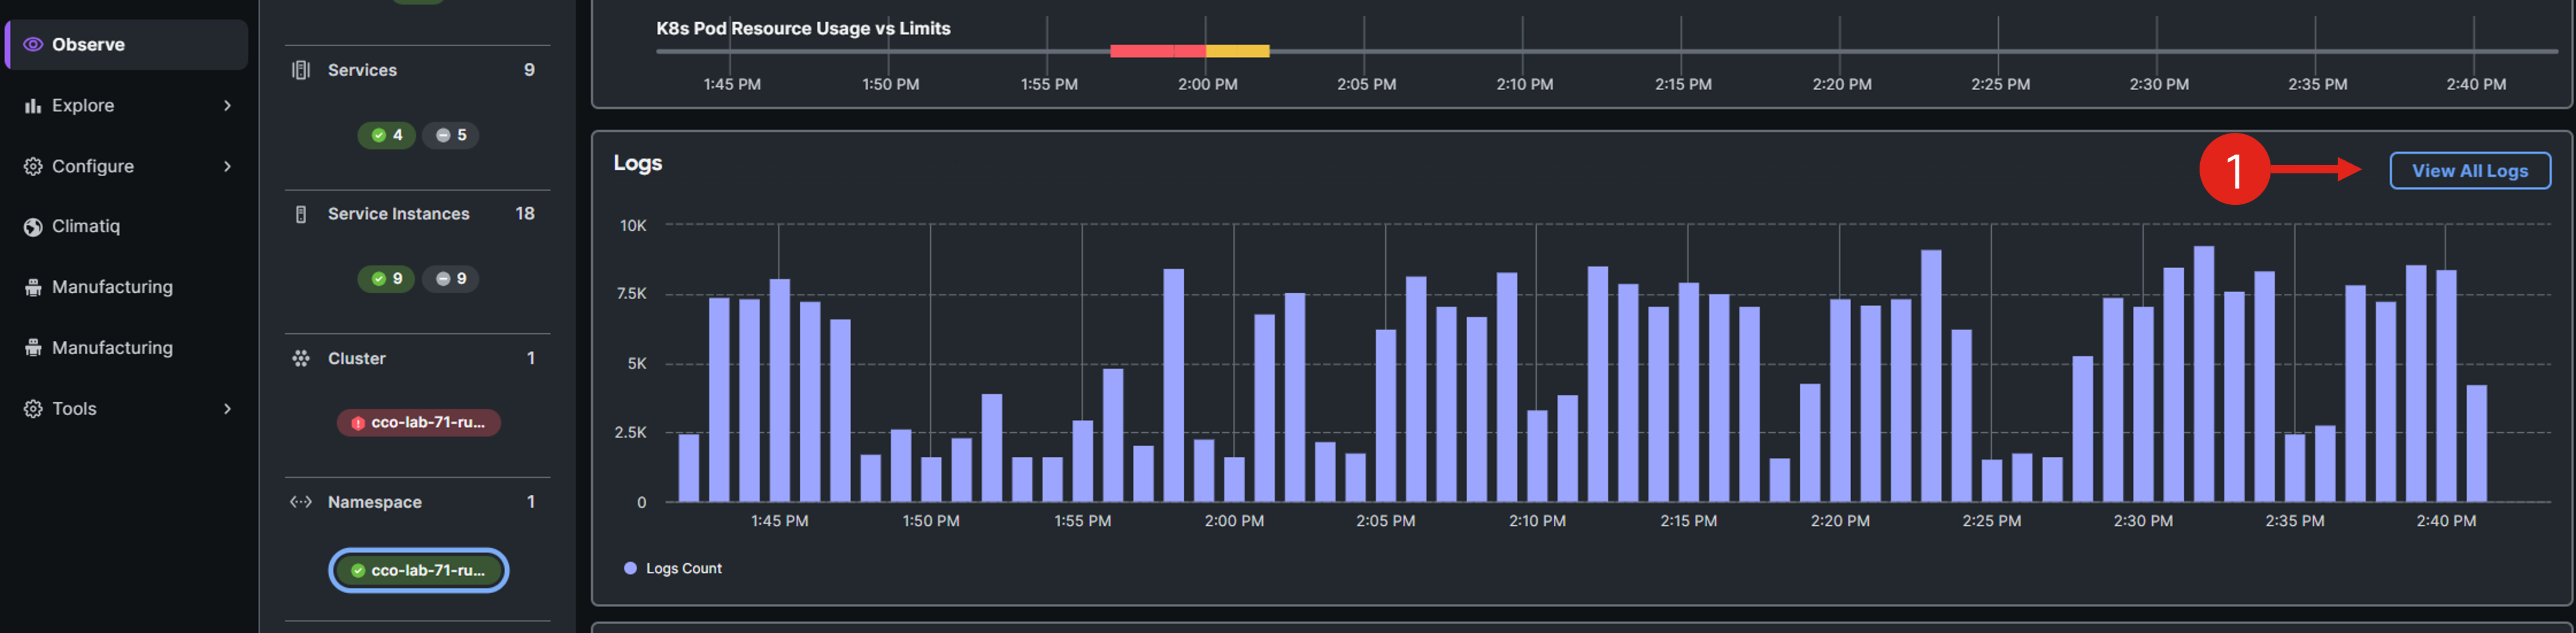
Change to Natural Language search mode, and in the search bar, enter a query like of which messages including "recommendation_server.py".
You can play around with different natural language search prompts.
Select one of the log messages from the list, and observe the log details in the panel on the right.
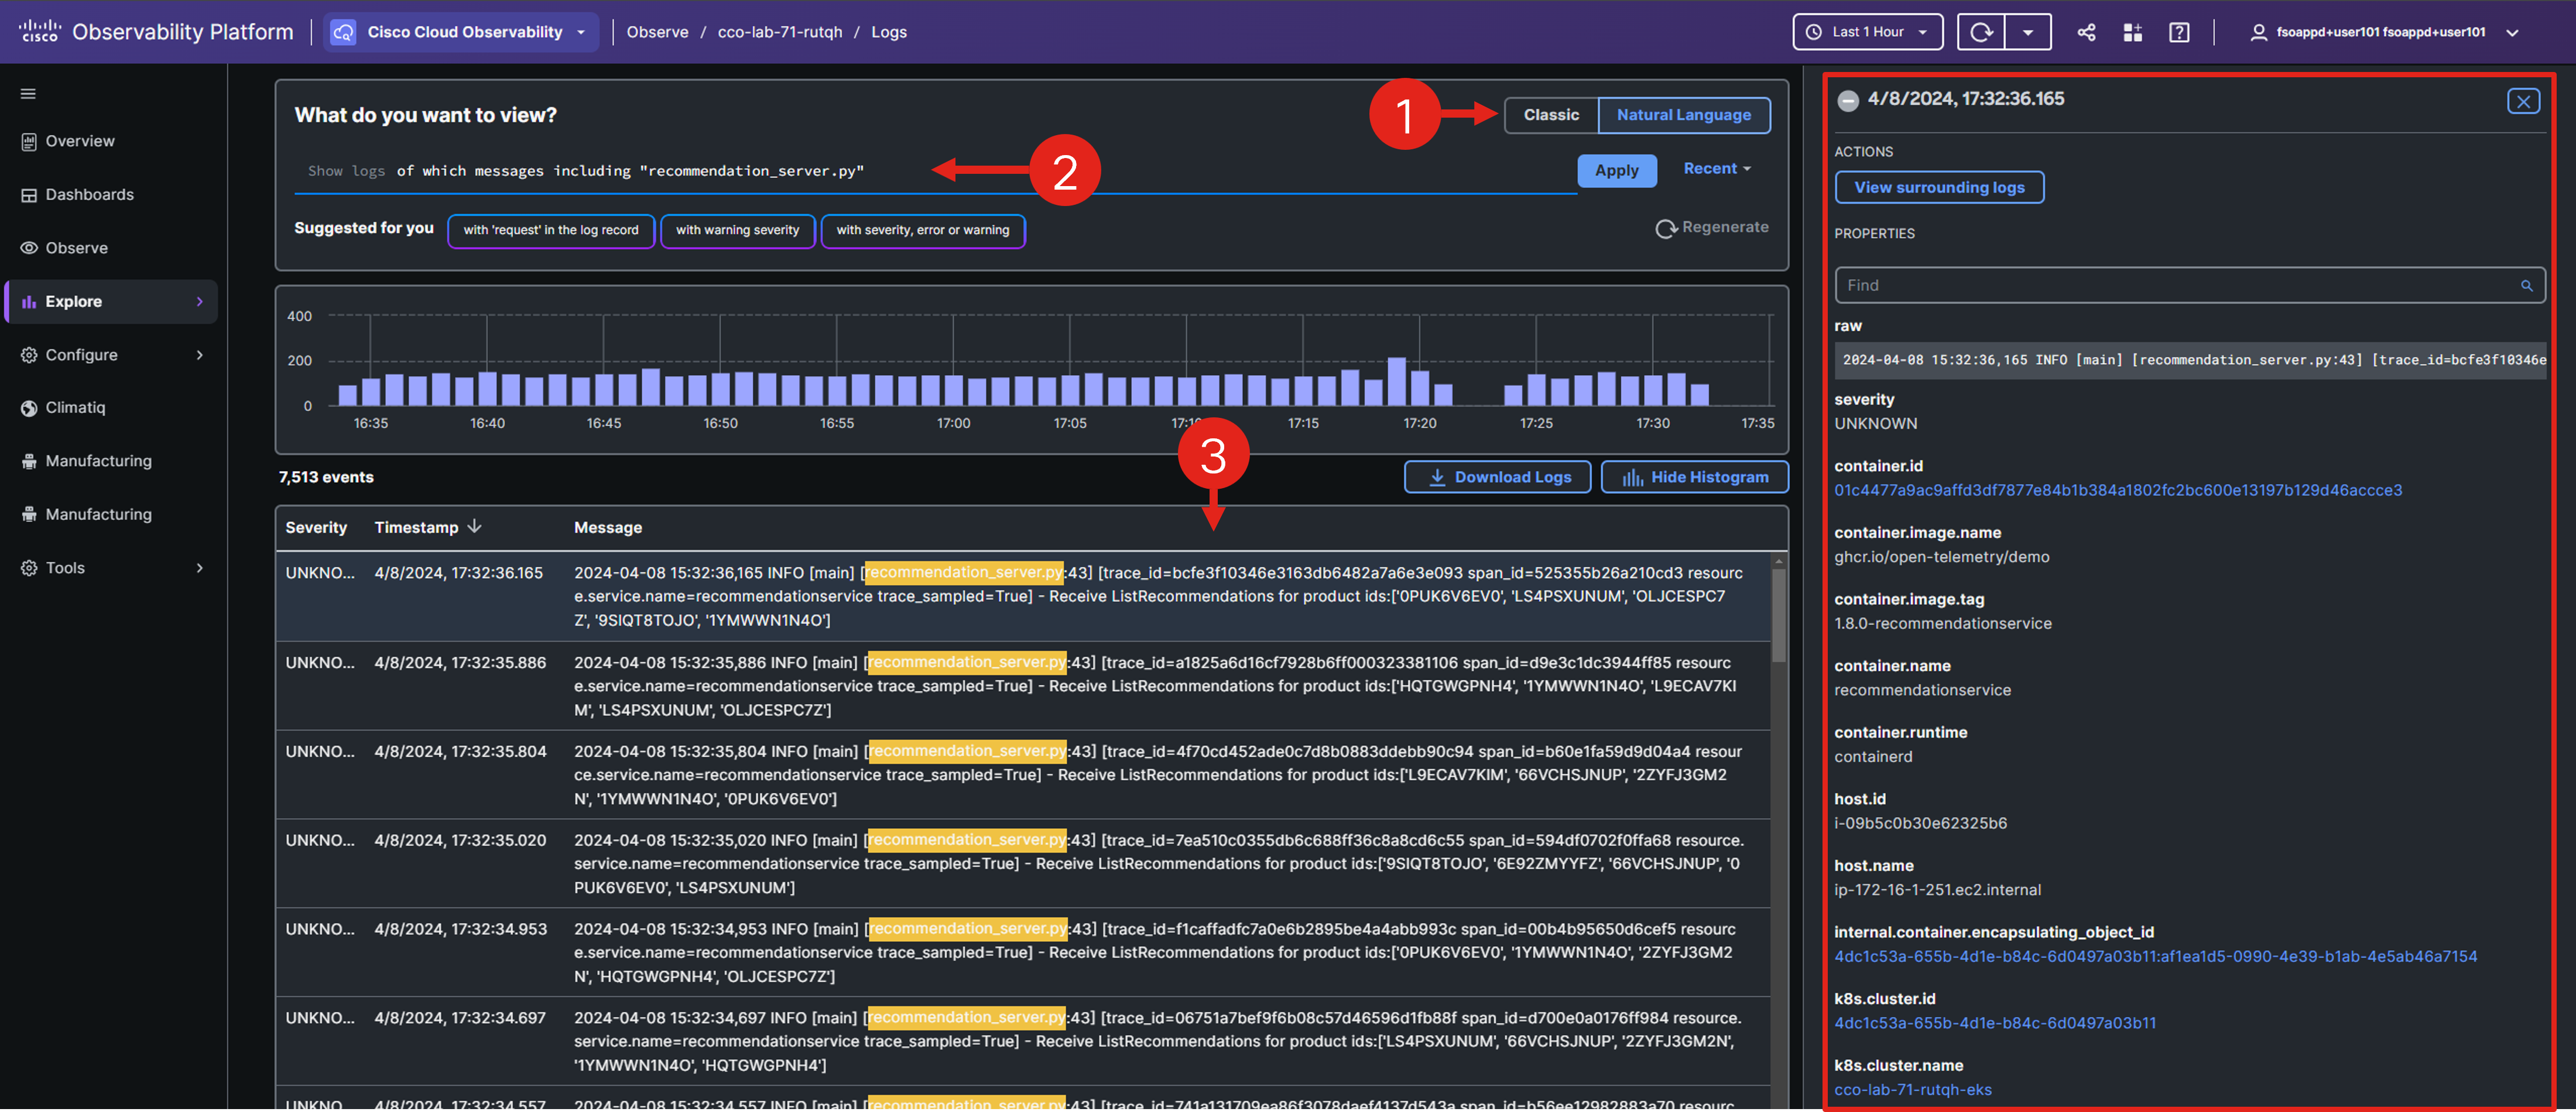
Learn more about troubleshooting with Logs by navigating here.
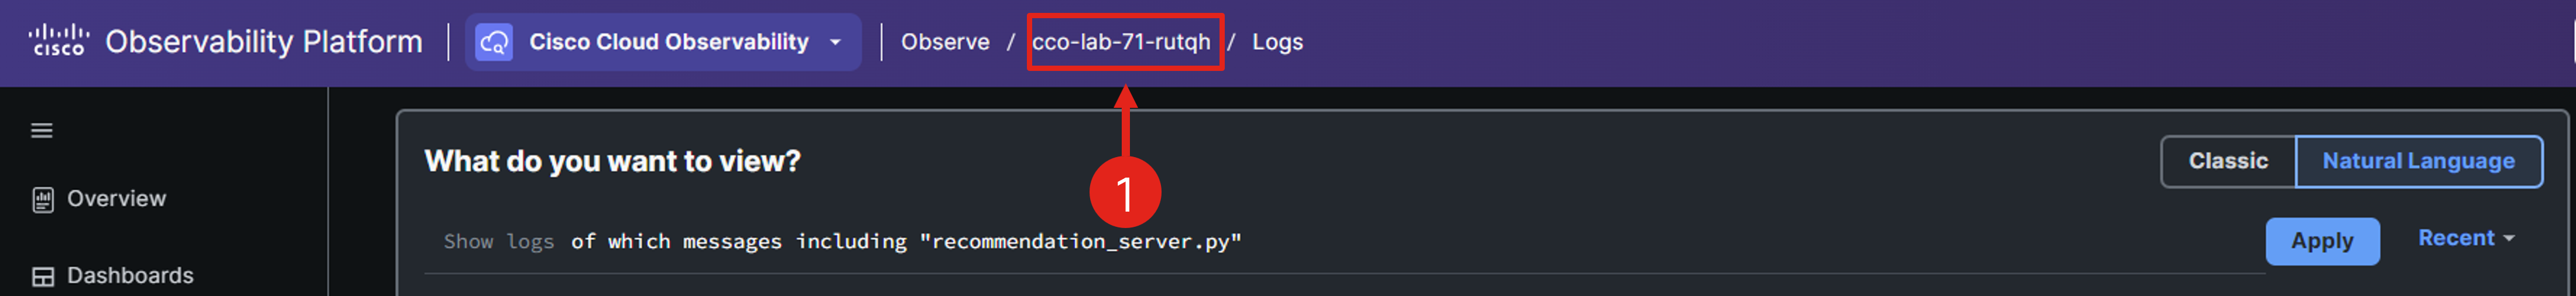
Click on the namespace name displayed in the breadcrumbs at the top of the interface, and return back to the Namespace entity.
Workloads Entity
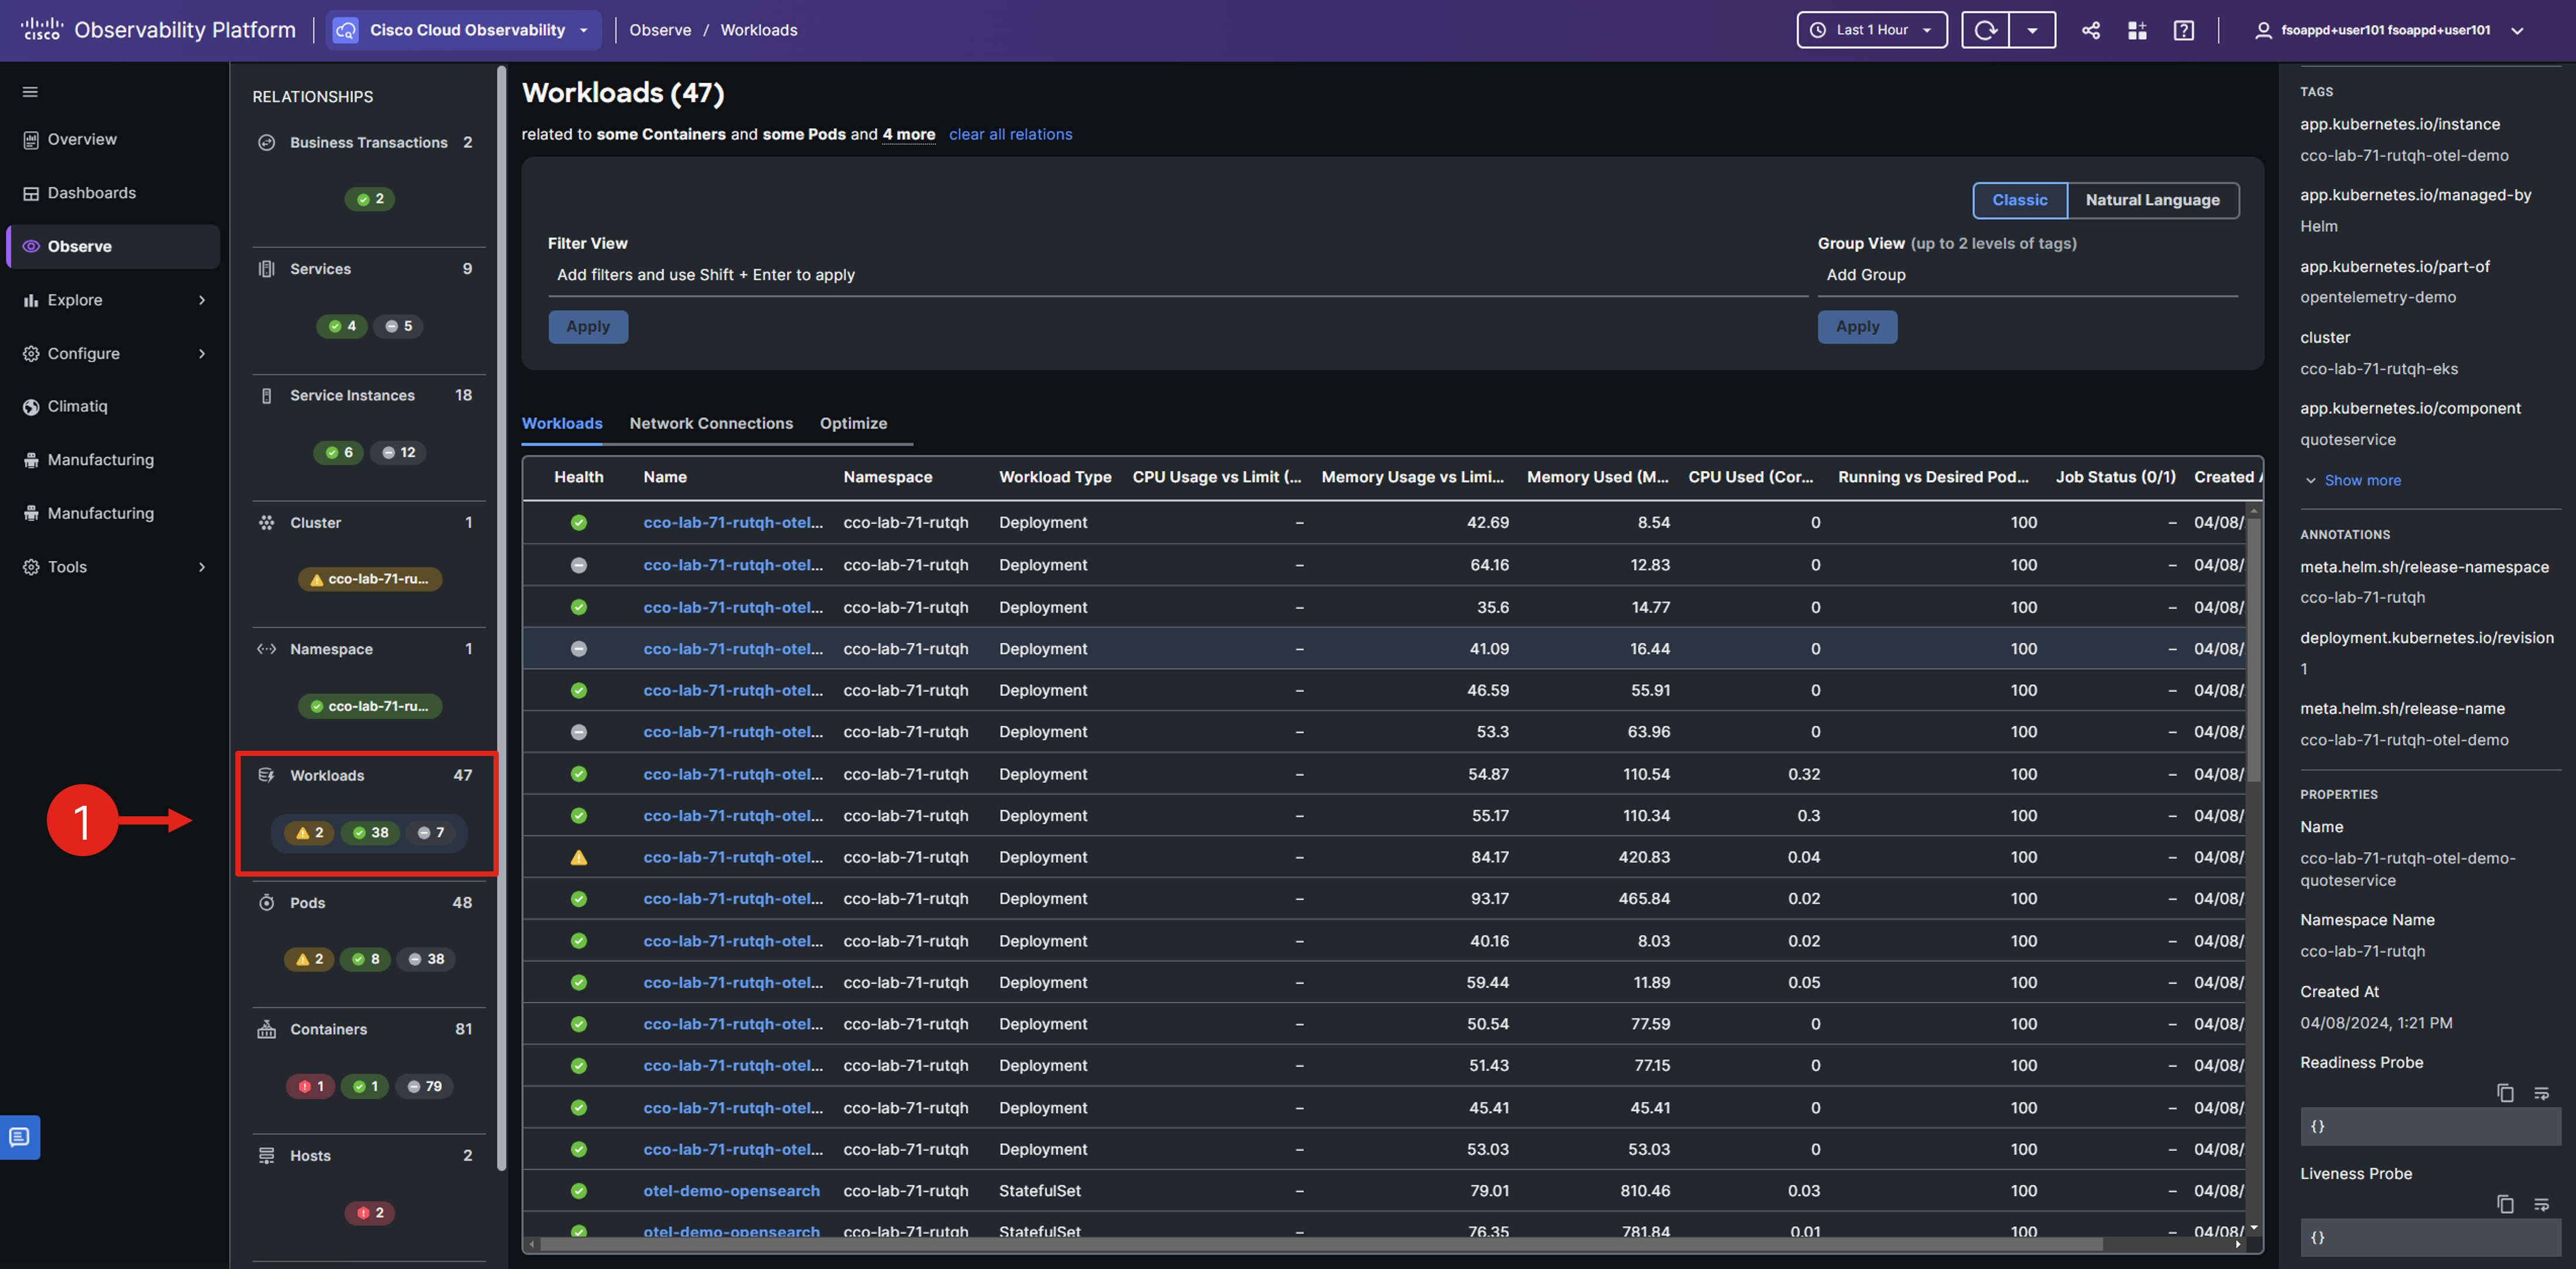
The Workloads page serves as a hub for both real-time and historical performance data of Kubernetes workloads. In Kubernetes, a workload represents an application in operation, with examples including Deployments and ReplicaSets.
Select the Workloads entity from the relationships panel to display all workloads. Observe that these workloads are linked to a specific namespace, indicated at the top of the screen, due to your access to the Workload entity via the Namespace entity.
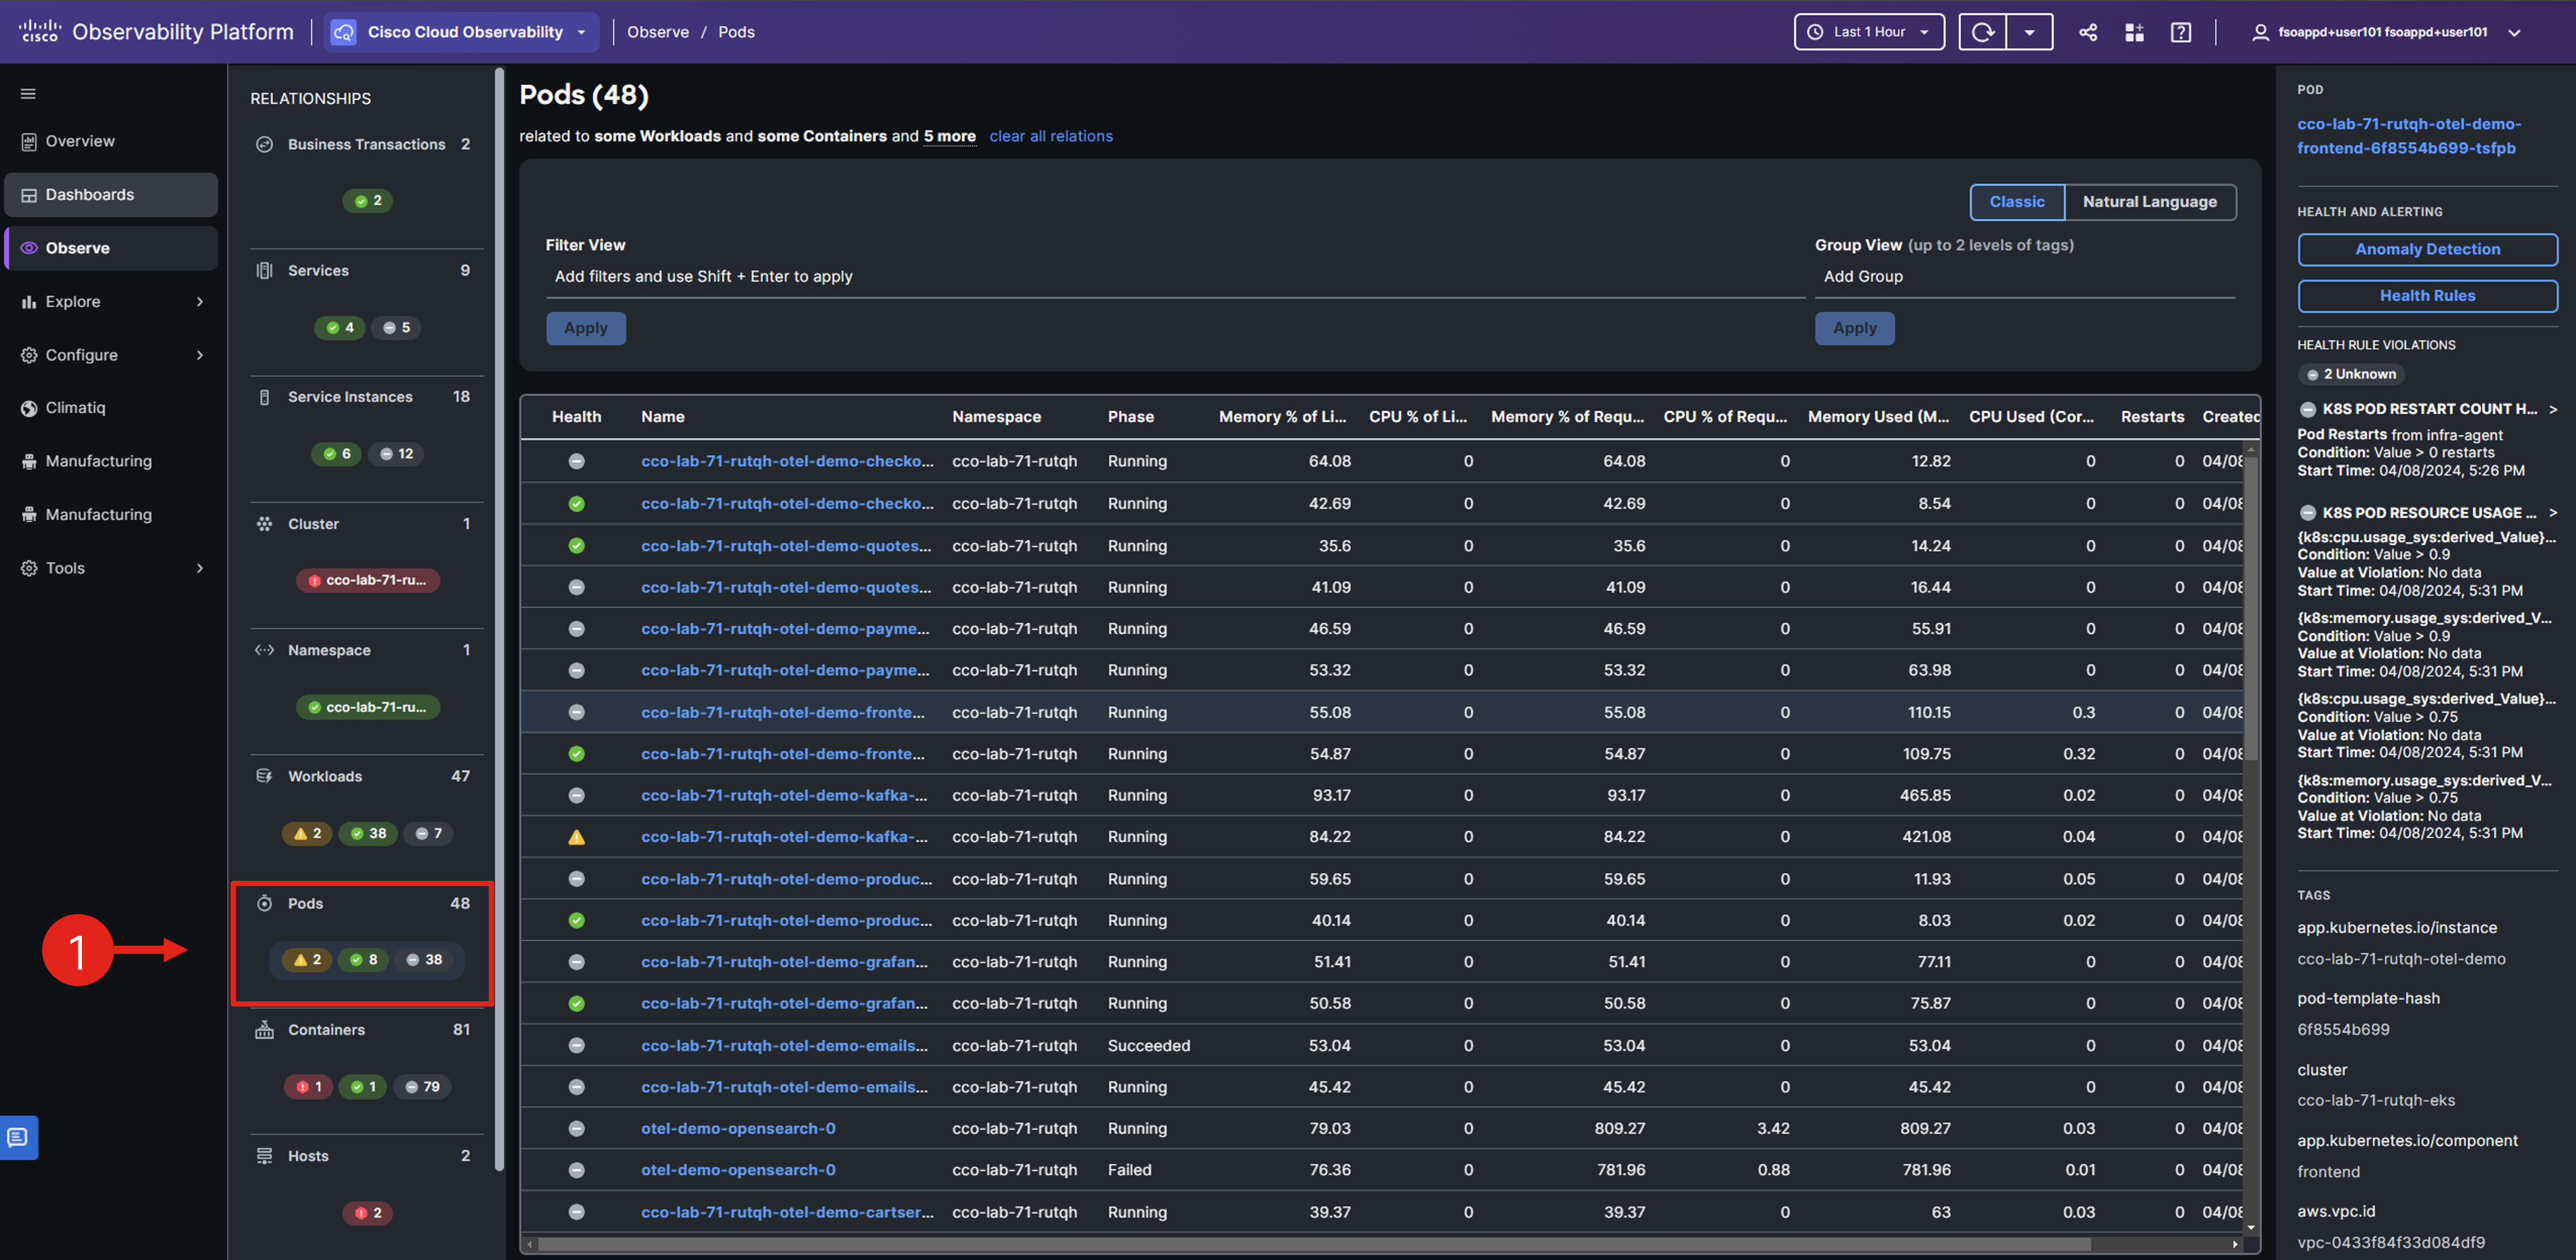
Pods Entity
You can use Pods entity to:
- Identify pods that are experiencing issues related to resource usage.
- Determine if pods are experiencing restarts or crashing issues that impact the availability.
- Determine if there are any changes in Kubernetes Configurations (ConfigMaps and Secrets) at pods level.
Choose the related Pods entity from the RELATIONSHIPS panel.
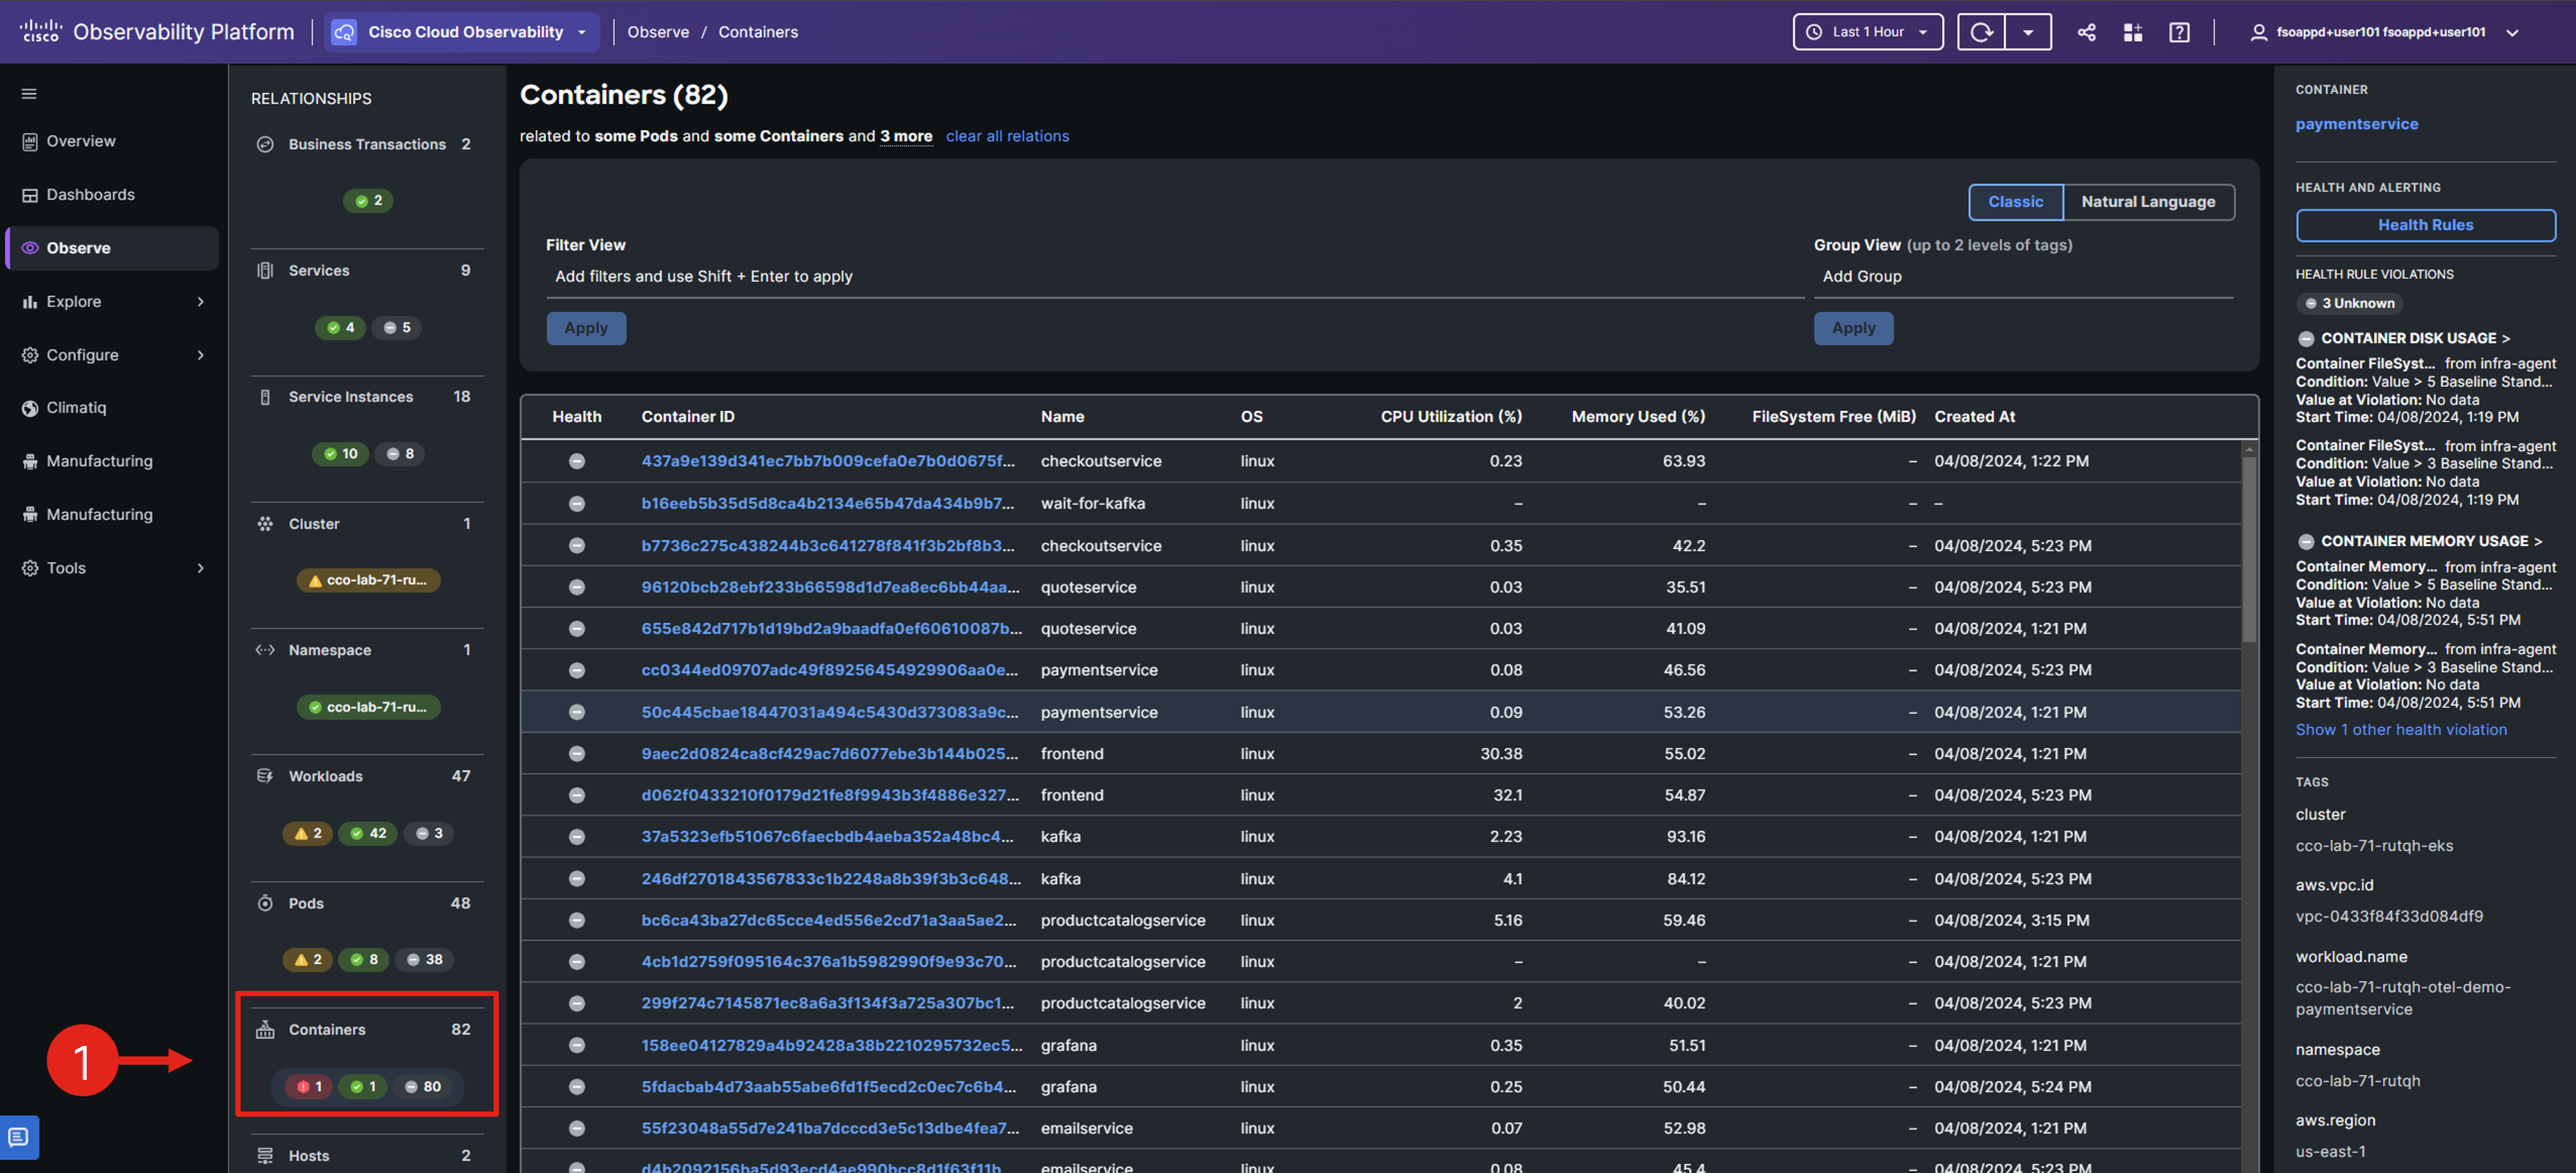
Containers Entity
The Containers page displays real-time and historical performance data for Kubernetes containers, with metrics sourced from cAdvisor via the Kubelet API. This page highlights resource utilization metrics for your containerized applications.
Click the Container entity. Using this entity menu, you can concentrate on the performance metrics specific to the related container.
Coming Up Next
Although you may have noticed the Service entities in the UI, you haven’t explored them yet. This exploration, focusing on application performance, is what you’ll tackle next.