Deploy and Instrument Application
In this segment, you’ll roll out the OpenTelemetry demo application, which comes pre-instrumented with the OpenTelemetry SDK and agents. This eliminates the need for you to manually instrument the app or deploy auto-instrumentation agents. The only modification you’ll need to make in the application’s deployment code is to direct the OpenTelemetry data to the collectors that were set up in earlier sections.
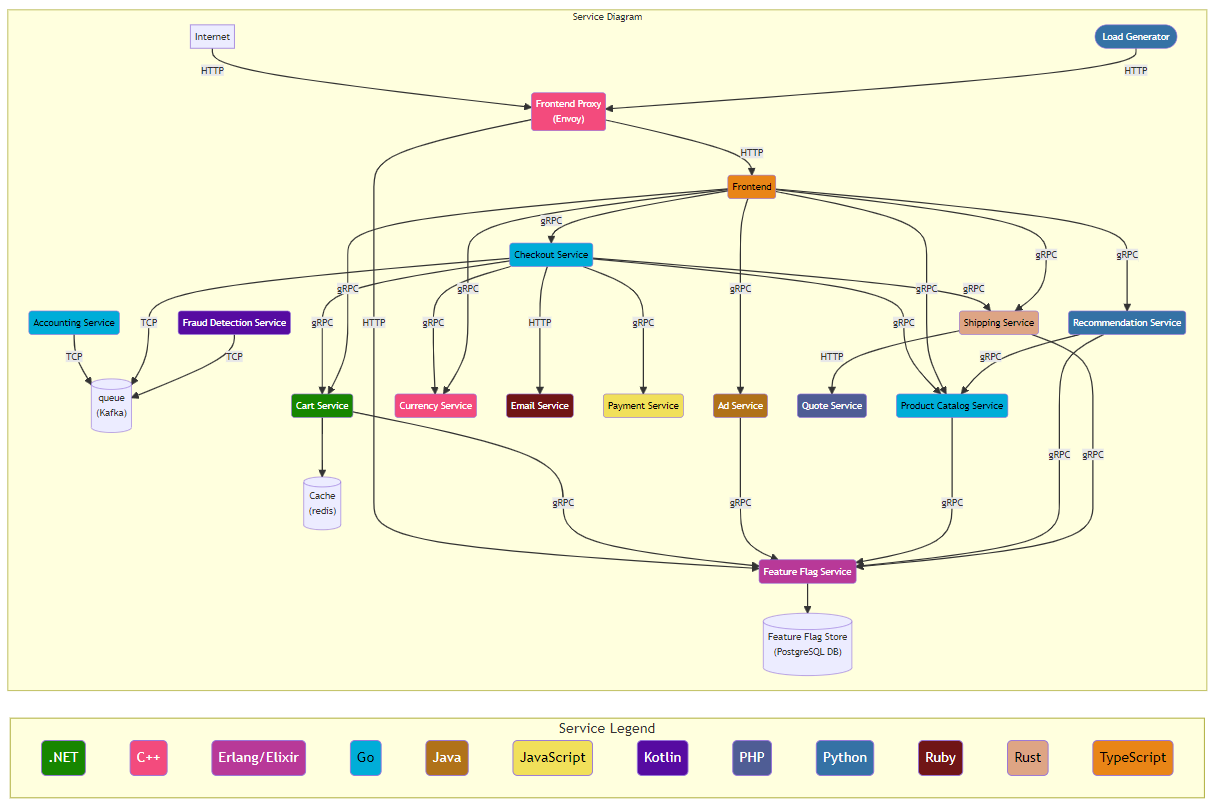
OpenTelemetry Demo consists of microservices written in different programming languages that communicate with each other via gRPC and HTTP, and a load generator that uses Locust to fake user traffic. The figure below showcases the application service diagram.
Deploy and Verify Application
You will use a Helm Chart to deploy the OpenTelemetry Demo application and override the default OpenTelemetry collector exporter settings to send the data to the AppDynamics Distribution of OpenTelemetry collectors that were previously set up.
Navigate to your Cloud9 environment and ensure that a terminal window is open.
Add the OpenTelemetry Helm Chart repository using the helm repo add command.
helm repo add open-telemetry https://open-telemetry.github.io/opentelemetry-helm-charts/# example
$ helm repo add open-telemetry https://open-telemetry.github.io/opentelemetry-helm-charts/
"open-telemetry" has been added to your repositoriesVerify the installed charts using the helm repo list command.
helm repo list# example
$ helm repo list
NAME URL
appdynamics-cloud-helmcharts https://appdynamics.jfrog.io/artifactory/appdynamics-cloud-helmcharts/
open-telemetry https://open-telemetry.github.io/opentelemetry-helm-charts/ Execute the kubectl create namespace command in the terminal window to create a new Kubernetes namespace.
kubectl create namespace $cco_lab_id# example
$ kubectl create namespace $cco_lab_id
namespace/cco-lab-01-nrmf4 createdDeploy the OpenTelemetry Demo application by overriding default values for the OpenTelemetry Collector exporters. Use the following command:
helm install \
  ${cco_lab_id}-otel-demo open-telemetry/opentelemetry-demo --version 0.29.2 \
  --set components.frontendProxy.service.type=LoadBalancer \
  --values otel-demo-webstore-override.yaml \
  -n $cco_lab_id
# example
$ helm install \
${cco_lab_id}-otel-demo open-telemetry/opentelemetry-demo \
--set components.frontendProxy.service.type=LoadBalancer \
--values otel-demo-webstore-override.yaml \
-n $cco_lab_id
NAME: cco-lab-01-nrmf4-otel-demo
<... output omitted ...>
██████╗ ████████╗███████╗██╗ ██████╗ ███████╗███╗ ███╗ ██████╗
██╔═══██╗╚══██╔══╝██╔════╝██║ ██╔══██╗██╔════╝████╗ ████║██╔═══██╗
██║ ██║ ██║ █████╗ ██║ ██║ ██║█████╗ ██╔████╔██║██║ ██║
██║ ██║ ██║ ██╔══╝ ██║ ██║ ██║██╔══╝ ██║╚██╔╝██║██║ ██║
╚██████╔╝ ██║ ███████╗███████╗ ██████╔╝███████╗██║ ╚═╝ ██║╚██████╔╝
╚═════╝ ╚═╝ ╚══════╝╚══════╝ ╚═════╝ ╚══════╝╚═╝ ╚═╝ ╚═════╝
- All services are available via the Frontend proxy: http://localhost:8080
by running these commands:
kubectl --namespace cco-lab-01-nrmf4 port-forward svc/cco-lab-01-nrmf4-otel-demo-frontendproxy 8080:8080
The following services are available at these paths once the proxy is exposed:
Webstore http://localhost:8080/
Grafana http://localhost:8080/grafana/
Feature Flags UI http://localhost:8080/feature/
Load Generator UI http://localhost:8080/loadgen/
Jaeger UI http://localhost:8080/jaeger/ui/The otel-demo-webstore-override.yaml file modifies the default OpenTelemetry settings to ensure telemetry data is directed to the AppDynamics version of the OpenTelemetry Collector, previously deployed on your Kubernetes cluster. View the file’s contents using the linux cat command.
cat otel-demo-webstore-override.yamlopentelemetry-collector:
config:
exporters:
otlp/cnao:
endpoint: "appdynamics-otel-collector-service.appdynamics.svc.cluster.local:4317"
<... output omitted ...>Verify OpenTelemetry Demo application deployment using the command kubectl get pods.
kubectl get pods -n $cco_lab_id# example
$ kubectl get pods -n $cco_lab_id
NAME READY STATUS RESTARTS AGE
cco-lab-01-nrmf4-otel-demo-accountingservice-668978b9d4-kjt2p 1/1 Running 0 4m9s
cco-lab-01-nrmf4-otel-demo-adservice-6f555cb5b4-wkdz8 1/1 Running 0 4m7s
cco-lab-01-nrmf4-otel-demo-cartservice-6d76744767-frcrc 1/1 Running 0 4m7s
cco-lab-01-nrmf4-otel-demo-checkoutservice-77dff88d57-vd9nn 1/1 Running 0 4m7s
<... output omitted ...>Make sure all pods are displayed in a Running state.
Verify creation of the Load Balancer using the command kubectl get services.
kubectl get services -n $cco_lab_id | grep "NAME\|otel-demo-frontendproxy" | grep -v grep # example
$ kubectl get services -n $cco_lab_id | grep "NAME\|otel-demo-frontendproxy" | grep -v grep
NAME TYPE CLUSTER-IP EXTERNAL-IP PORT(S) AGE
cco-lab-01-nrmf4-otel-demo-frontendproxy LoadBalancer 10.100.186.168 a9bb1339adec74ee3bd3d93b215342fb-462365071.us-east-2.elb.amazonaws.com 8080:30951/TCP 11mMake sure that an IP address and service URL are available.
Check the pod logs to make sure they show activity, indicating that tracing data is being transmitted to the collector. Use the command kubectl logs with adservice as a test example.
kubectl logs $(kubectl get pods -n $cco_lab_id | awk '/adservice/ {print $1}') -n $cco_lab_id# example
$ kubectl logs $(kubectl get pods -n $cco_lab_id | awk '/adservice/ {print $1}') -n $cco_lab_id
<... output omitted ...>
2024-02-09 18:42:18 - oteldemo.AdService - Ad service starting. trace_id= span_id= trace_flags=
2024-02-09 18:42:20 - oteldemo.AdService - Ad service started, listening on 8080 trace_id= span_id= trace_flags=
2024-02-09 18:42:32 - oteldemo.AdService - Targeted ad request received for [binoculars] trace_id=98f074a2e6bc7cf1cdf3f7670fc46049 span_id=9afe90b85feee25e trace_flags=01
2024-02-09 18:42:33 - oteldemo.AdService - Targeted ad request received for [books] trace_id=40041206831431f0d265e422b026c7c2 span_id=78934c6162e897f4 trace_flags=01
2024-02-09 18:42:44 - oteldemo.AdService - Targeted ad request received for [assembly] trace_id=6105ec022d0492e8135786bee6b6dfb1 span_id=f1c225fda804e7d3 trace_flags=01
2024-02-09 18:42:45 - oteldemo.AdService - Non-targeted ad request received, preparing random response. trace_id=8197c79e8837ff2aa1532d5103fc1455 span_id=77bd470c1d0dcb58 trace_flags=01
2024-02-09 18:42:56 - oteldemo.AdService - Targeted ad request received for [travel] trace_id=b2a220e77ef4ddc6b6ae80f5edf1024b span_id=b1d22e2f82603d5f trace_flags=01
2024-02-09 18:43:00 - oteldemo.AdService - Targeted ad request received for [travel] trace_id=fea3b2a356d761c7f9e800a36140399c span_id=032e3ac6aae1a3a1 trace_flags=01
2024-02-09 18:43:15 - oteldemo.AdService - Targeted ad request received for [binoculars] trace_id=e0bb76b84392f97f9c9f287fac7c9ee6 span_id=6ac81da39d2419ad trace_flags=01
2024-02-09 18:43:33 - oteldemo.AdService - Targeted ad request received for [binoculars] trace_id=f6c4a1e2f8ffedb9c82fd98cd2ae55c4 span_id=8ad125097e4c15e2 trace_flags=01
2024-02-09 18:43:35 - oteldemo.AdService - Non-targeted ad request received, preparing random response. trace_id=cd4acca37e78bb91f3c26681e5caa2d0 span_id=0df525facf63f197 trace_flags=01
2024-02-09 18:43:35 - oteldemo.AdService - Targeted ad request received for [binoculars] trace_id=1ec5ce4abf4b524a652853896af45f61 span_id=fc24b29fcc46a4e3 trace_flags=01
<... output omitted ...>Run the command otel_demo_urls to obtain all URLs related to the otel demo services.
otel_demo_urls# example
$ otel_demo_urls
------------------------------------------------------------------------------------------------------------------------
OpenTelemetry Demo Application URLs
------------------------------------------------------------------------------------------------------------------------
The following services will be available once the Load Balancer has completed its Health checks:
Webstore: http://a9bb1339adec74ee3bd3d93b215342fb-462365071.us-east-2.elb.amazonaws.com:8080/
Grafana: http://a9bb1339adec74ee3bd3d93b215342fb-462365071.us-east-2.elb.amazonaws.com:8080/grafana/
Feature Flags UI: http://a9bb1339adec74ee3bd3d93b215342fb-462365071.us-east-2.elb.amazonaws.com:8080/feature/
Load Generator UI: http://a9bb1339adec74ee3bd3d93b215342fb-462365071.us-east-2.elb.amazonaws.com:8080/loadgen/
Jaeger UI: http://a9bb1339adec74ee3bd3d93b215342fb-462365071.us-east-2.elb.amazonaws.com:8080/jaeger/ui/
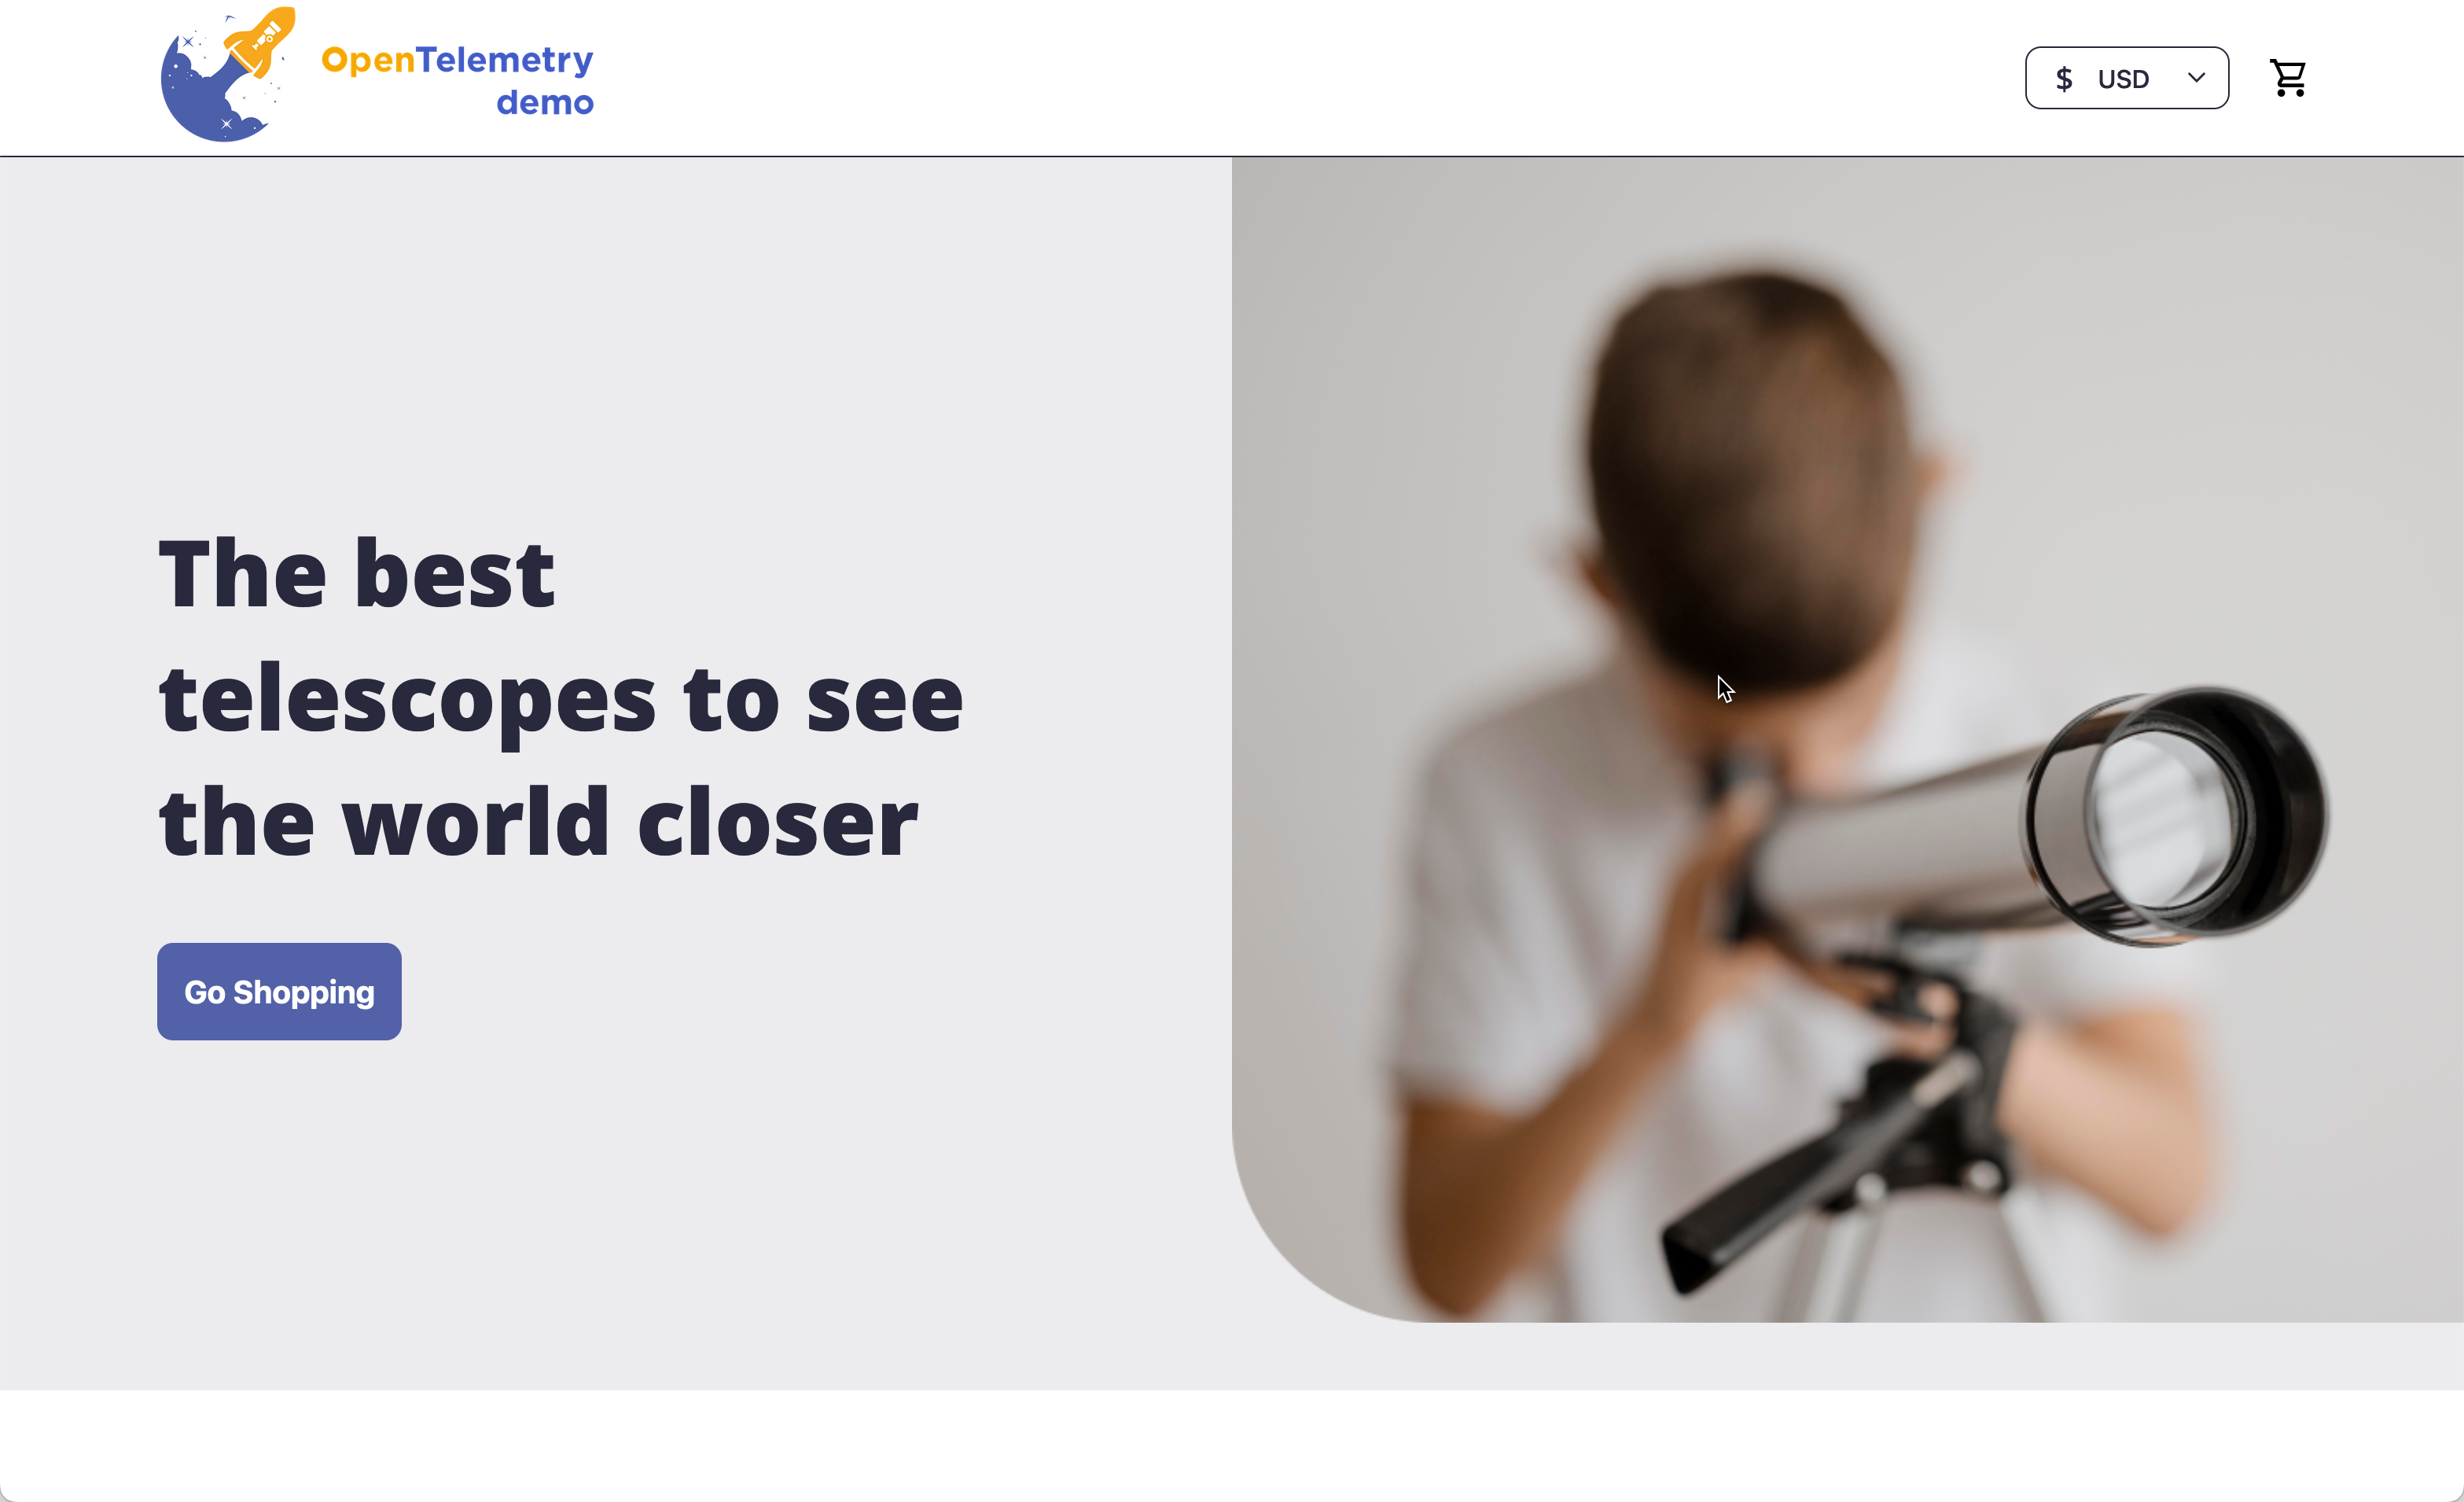
------------------------------------------------------------------------------------------------------------------------Select the Webstore link and click on Open to confirm that the application has been deployed successfully.
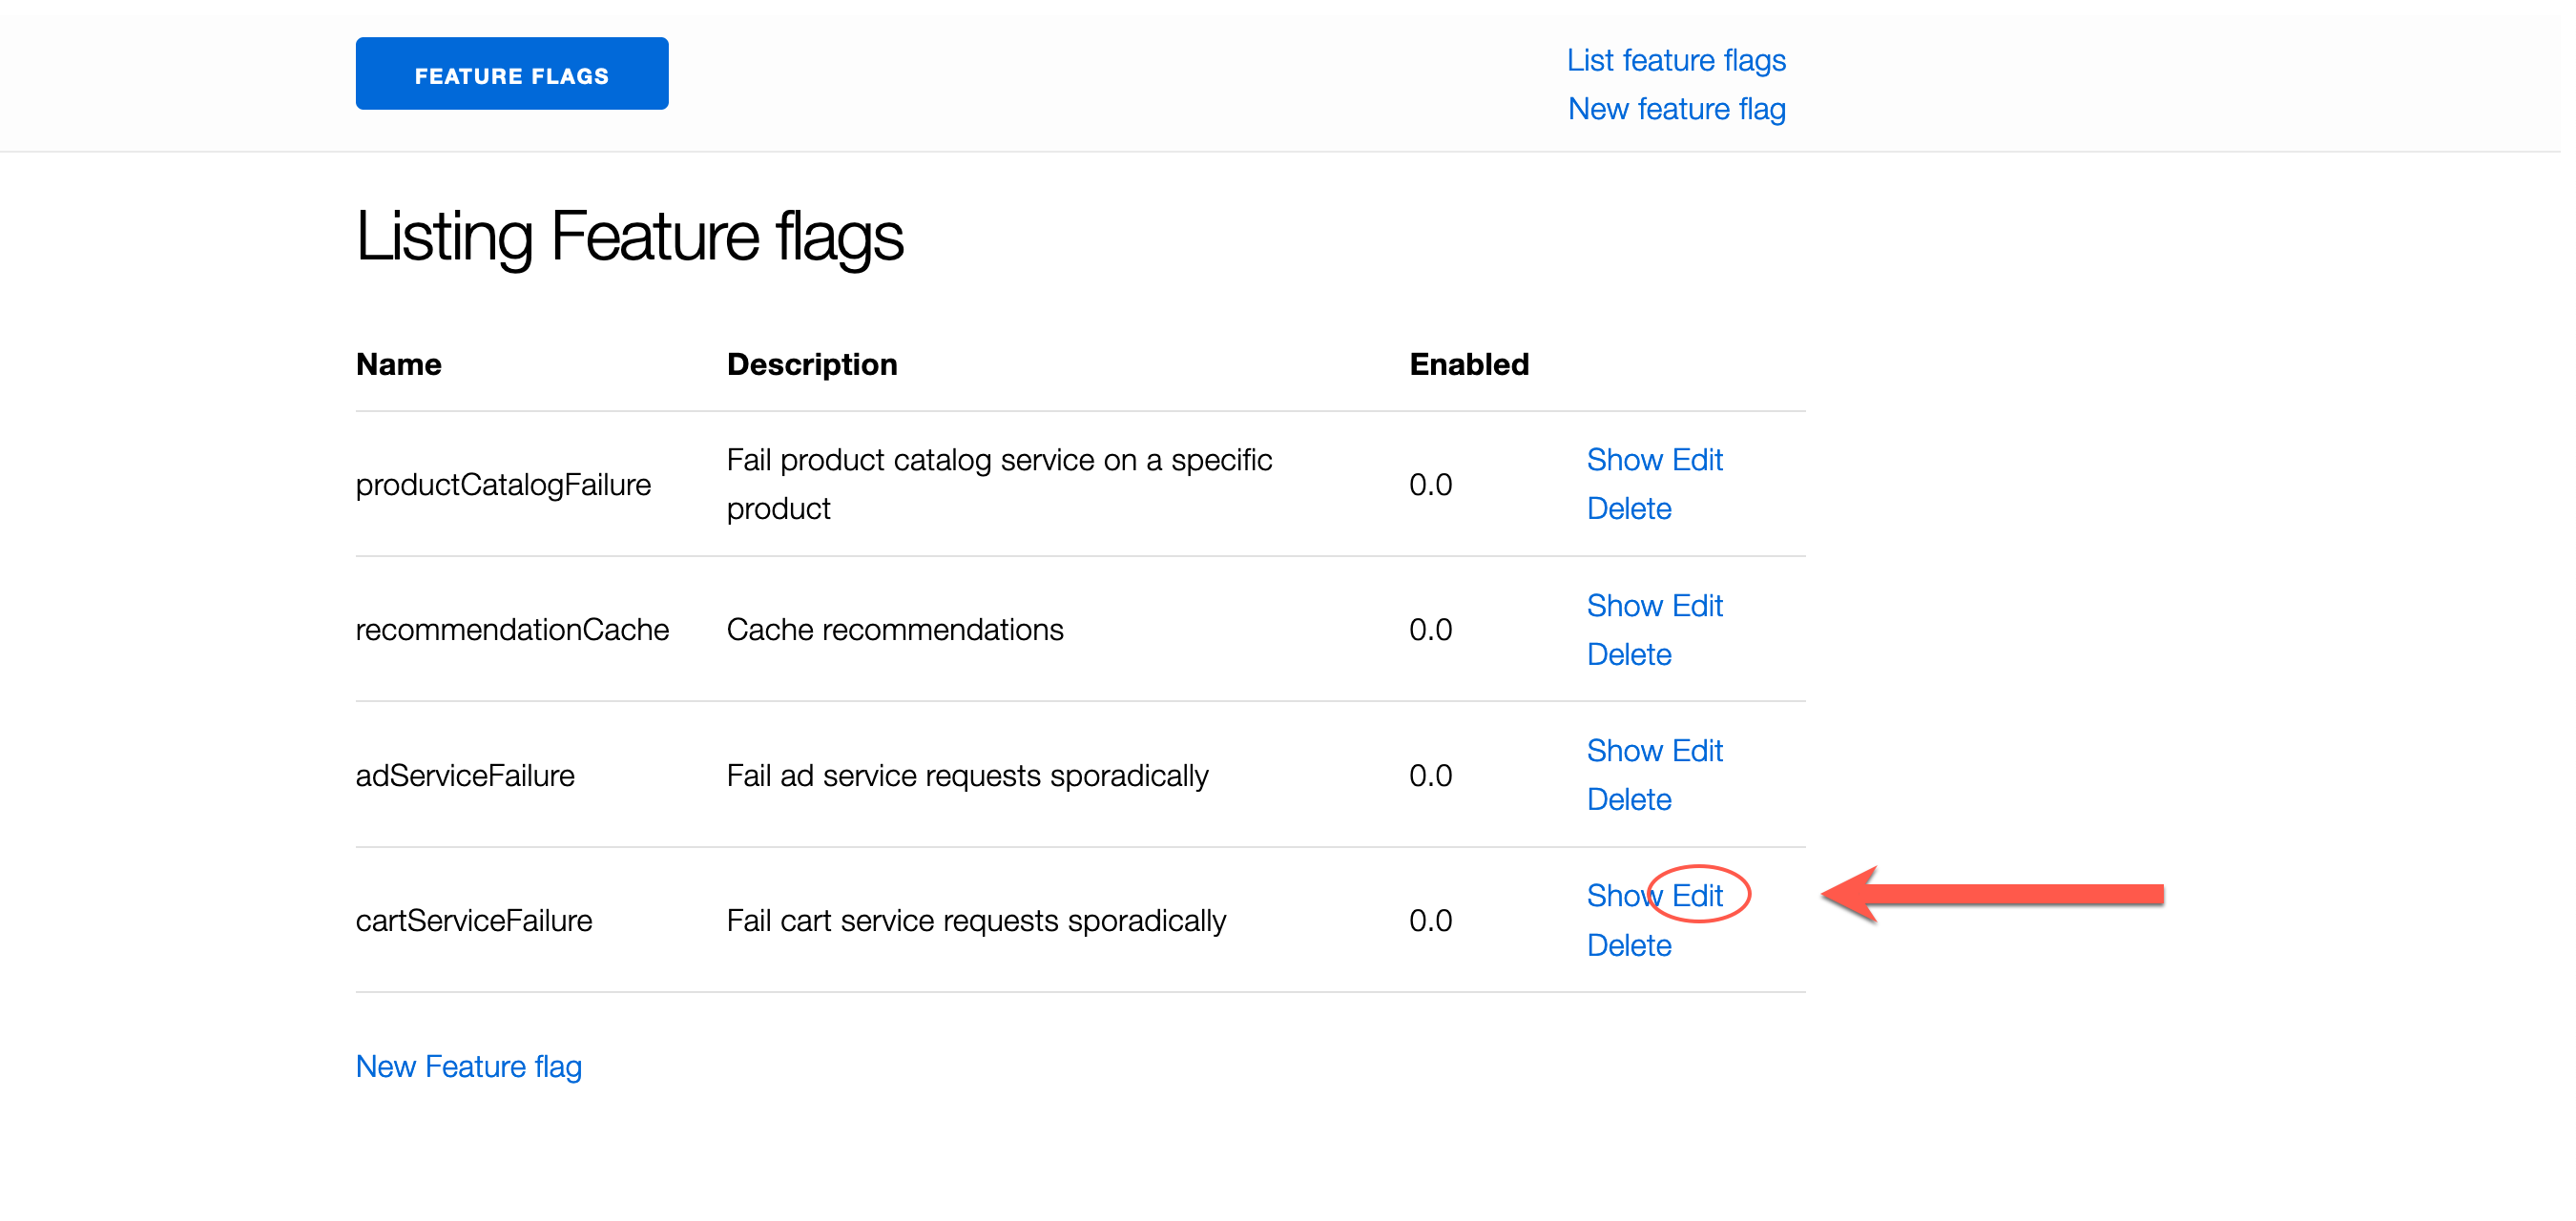
Use the OpenTelemetry Demo Application URLs to access the Feature Flags UI in your browser and modify the CartServiceFailure feature.
Activate this feature by entering 0.75 into the text box and clicking the Save button to save your changes.
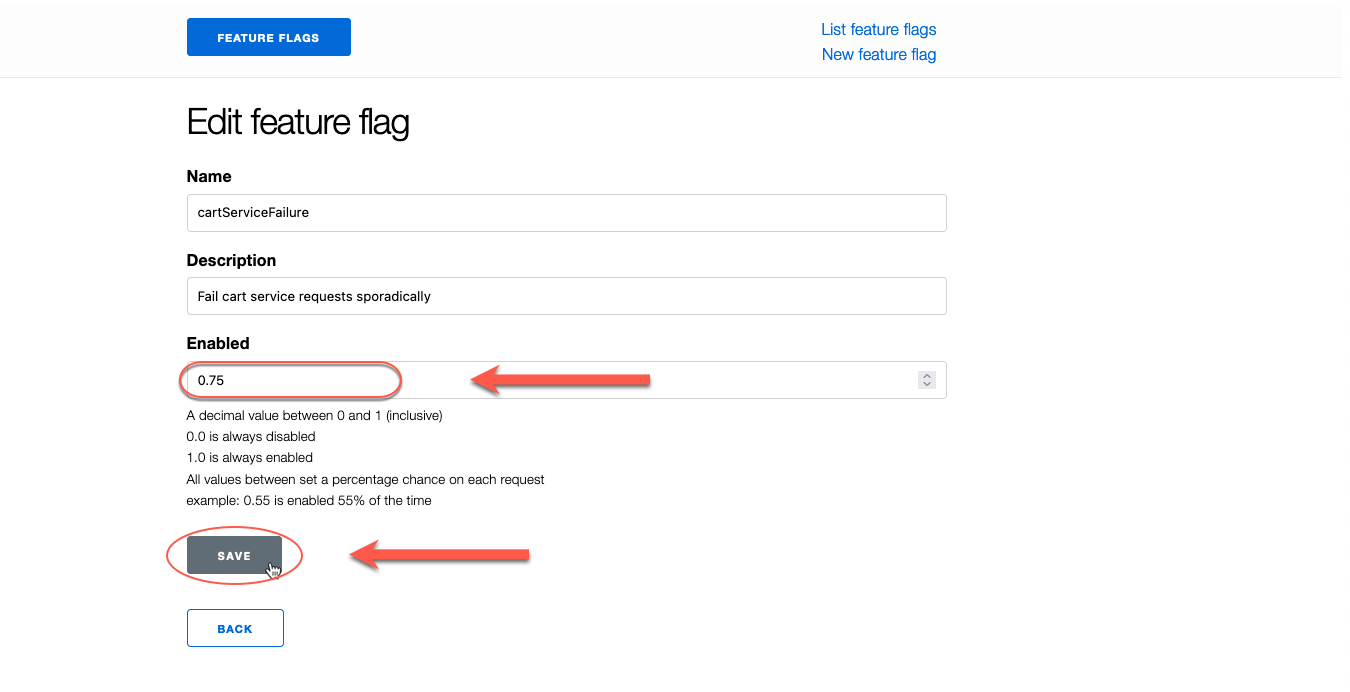
Review the cartServiceFailure feature flag settings and click the Back button to return to the Listing Feature flags page.
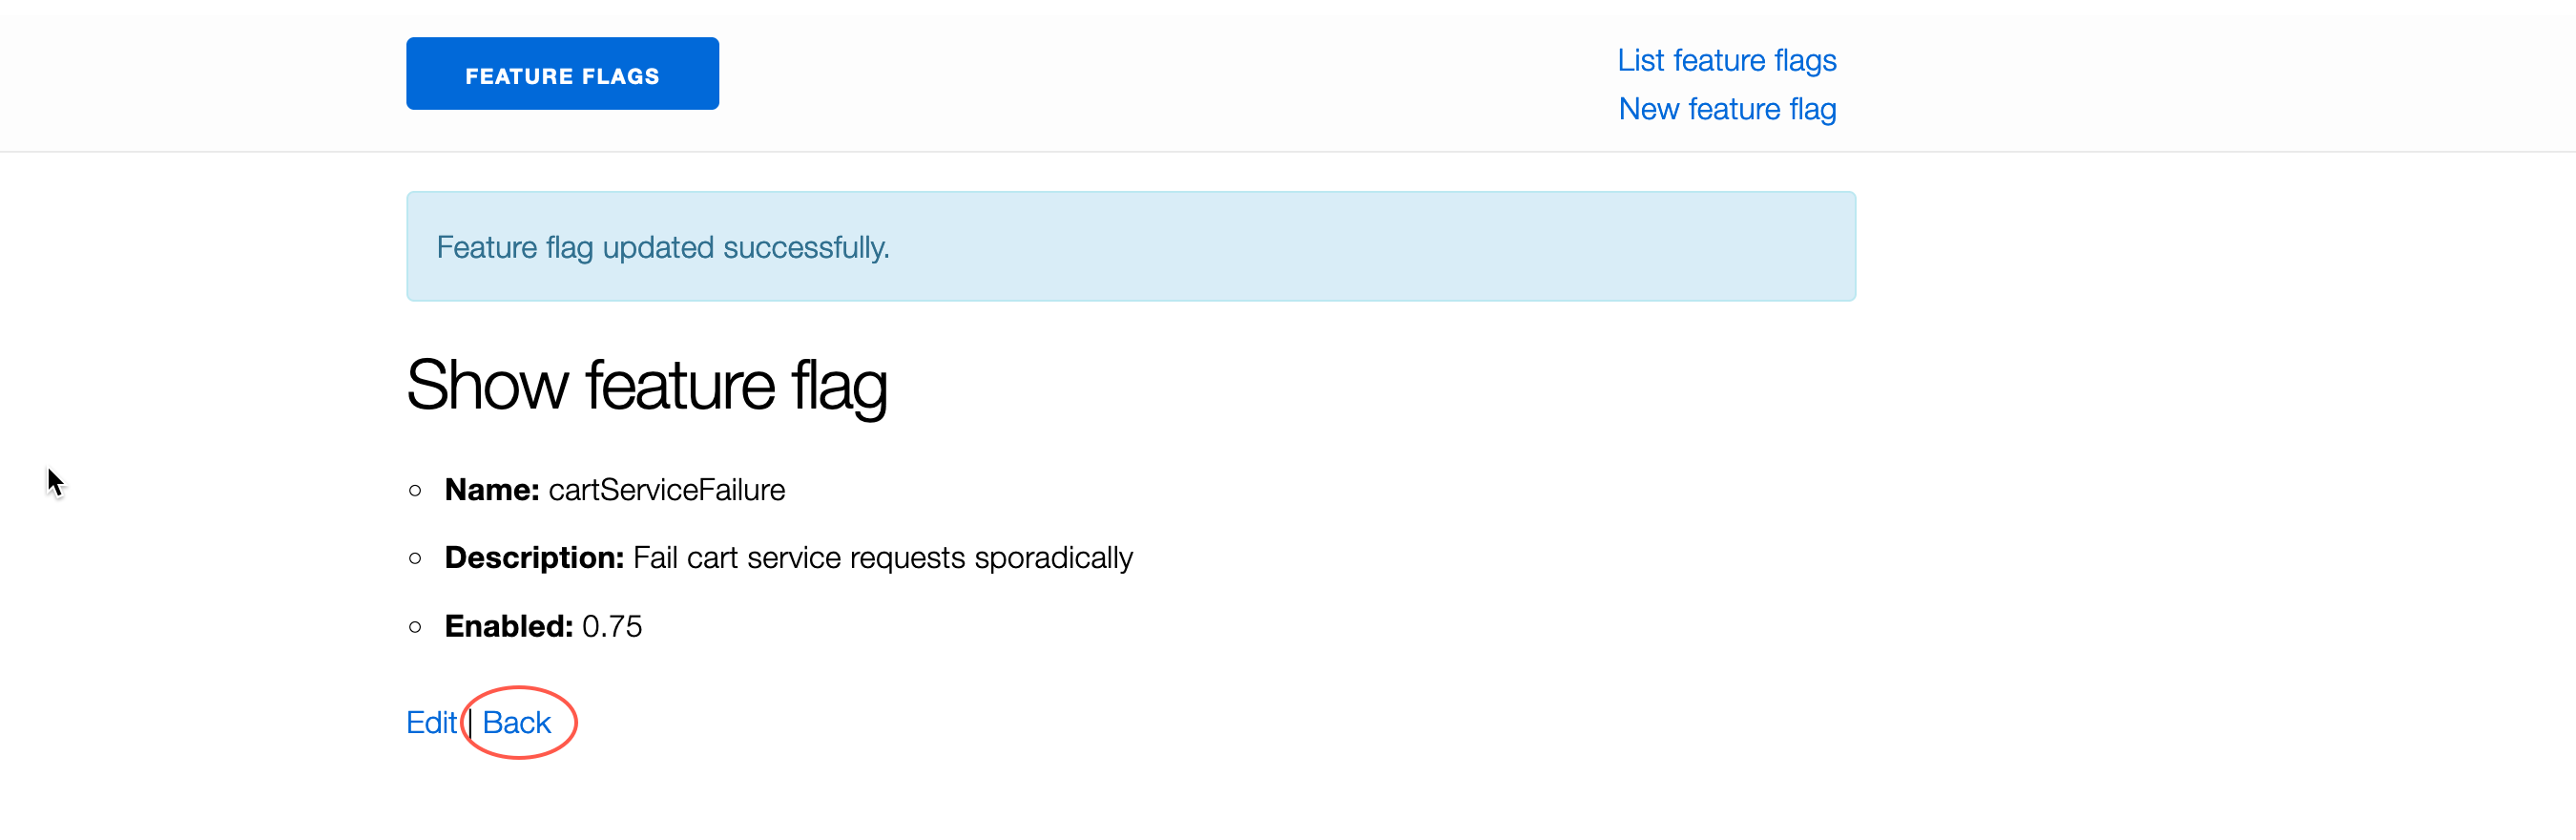
This ensures that the application produces errors for later observation in CCO.
Observability in the Cisco Cloud Observability Tenant - First Look
Before you can check to see if the OpenTelemetry collector is sending any data to the CCO platform, you need to generate a Filter View statement that can be used to filter the observability in the CCO UI to the services specific to your lab environment using the custom cco_lab_id namespace.
Note: There are other attributes which can also be used to filter your services. You’ll be using some of those later in the Explore CCO section.
Run the linux echo command to print out a custom Filter View statement.
echo "EntityStatus = 'active' && attributes(service.namespace) = '${cco_lab_id}'"# example
$ echo "EntityStatus = 'active' && attributes(service.namespace) = '${cco_lab_id}'"
EntityStatus = 'active' && attributes(service.namespace) = 'cco-lab-01-nrmf4'Next, navigate to your CCO tenant and go to the Observe page.
Copy and replace the EntityStatus = ‘active’ statement with the one you printed out in the previous step.
Click the Apply button. This will narrow down the display to services specific to your lab environment.
Scroll down (if needed) to the Application Performance Monitoring section. Click the on the Services label.
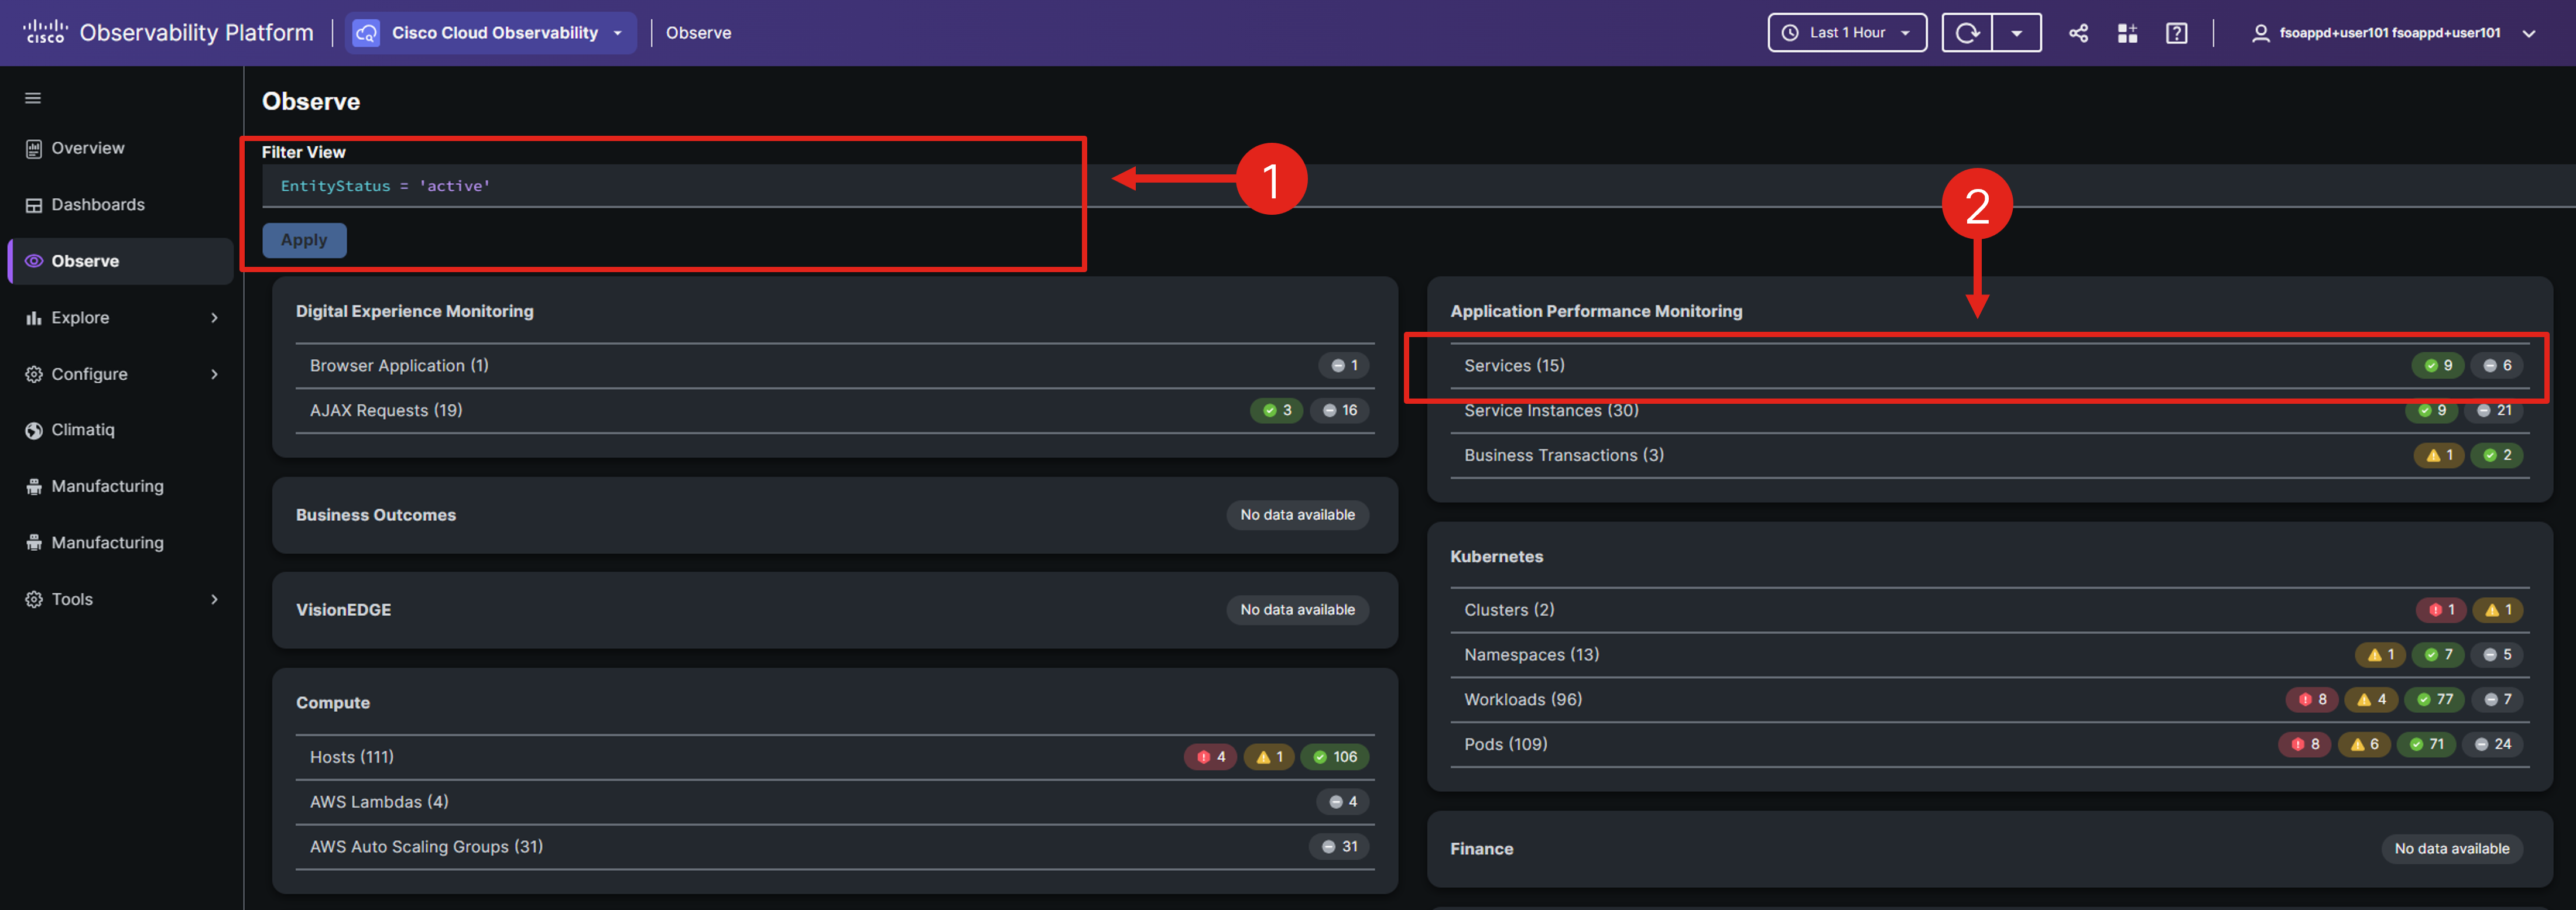
You can now view your OpenTelemetry Demo application deployment; filtered by your custom namespace.
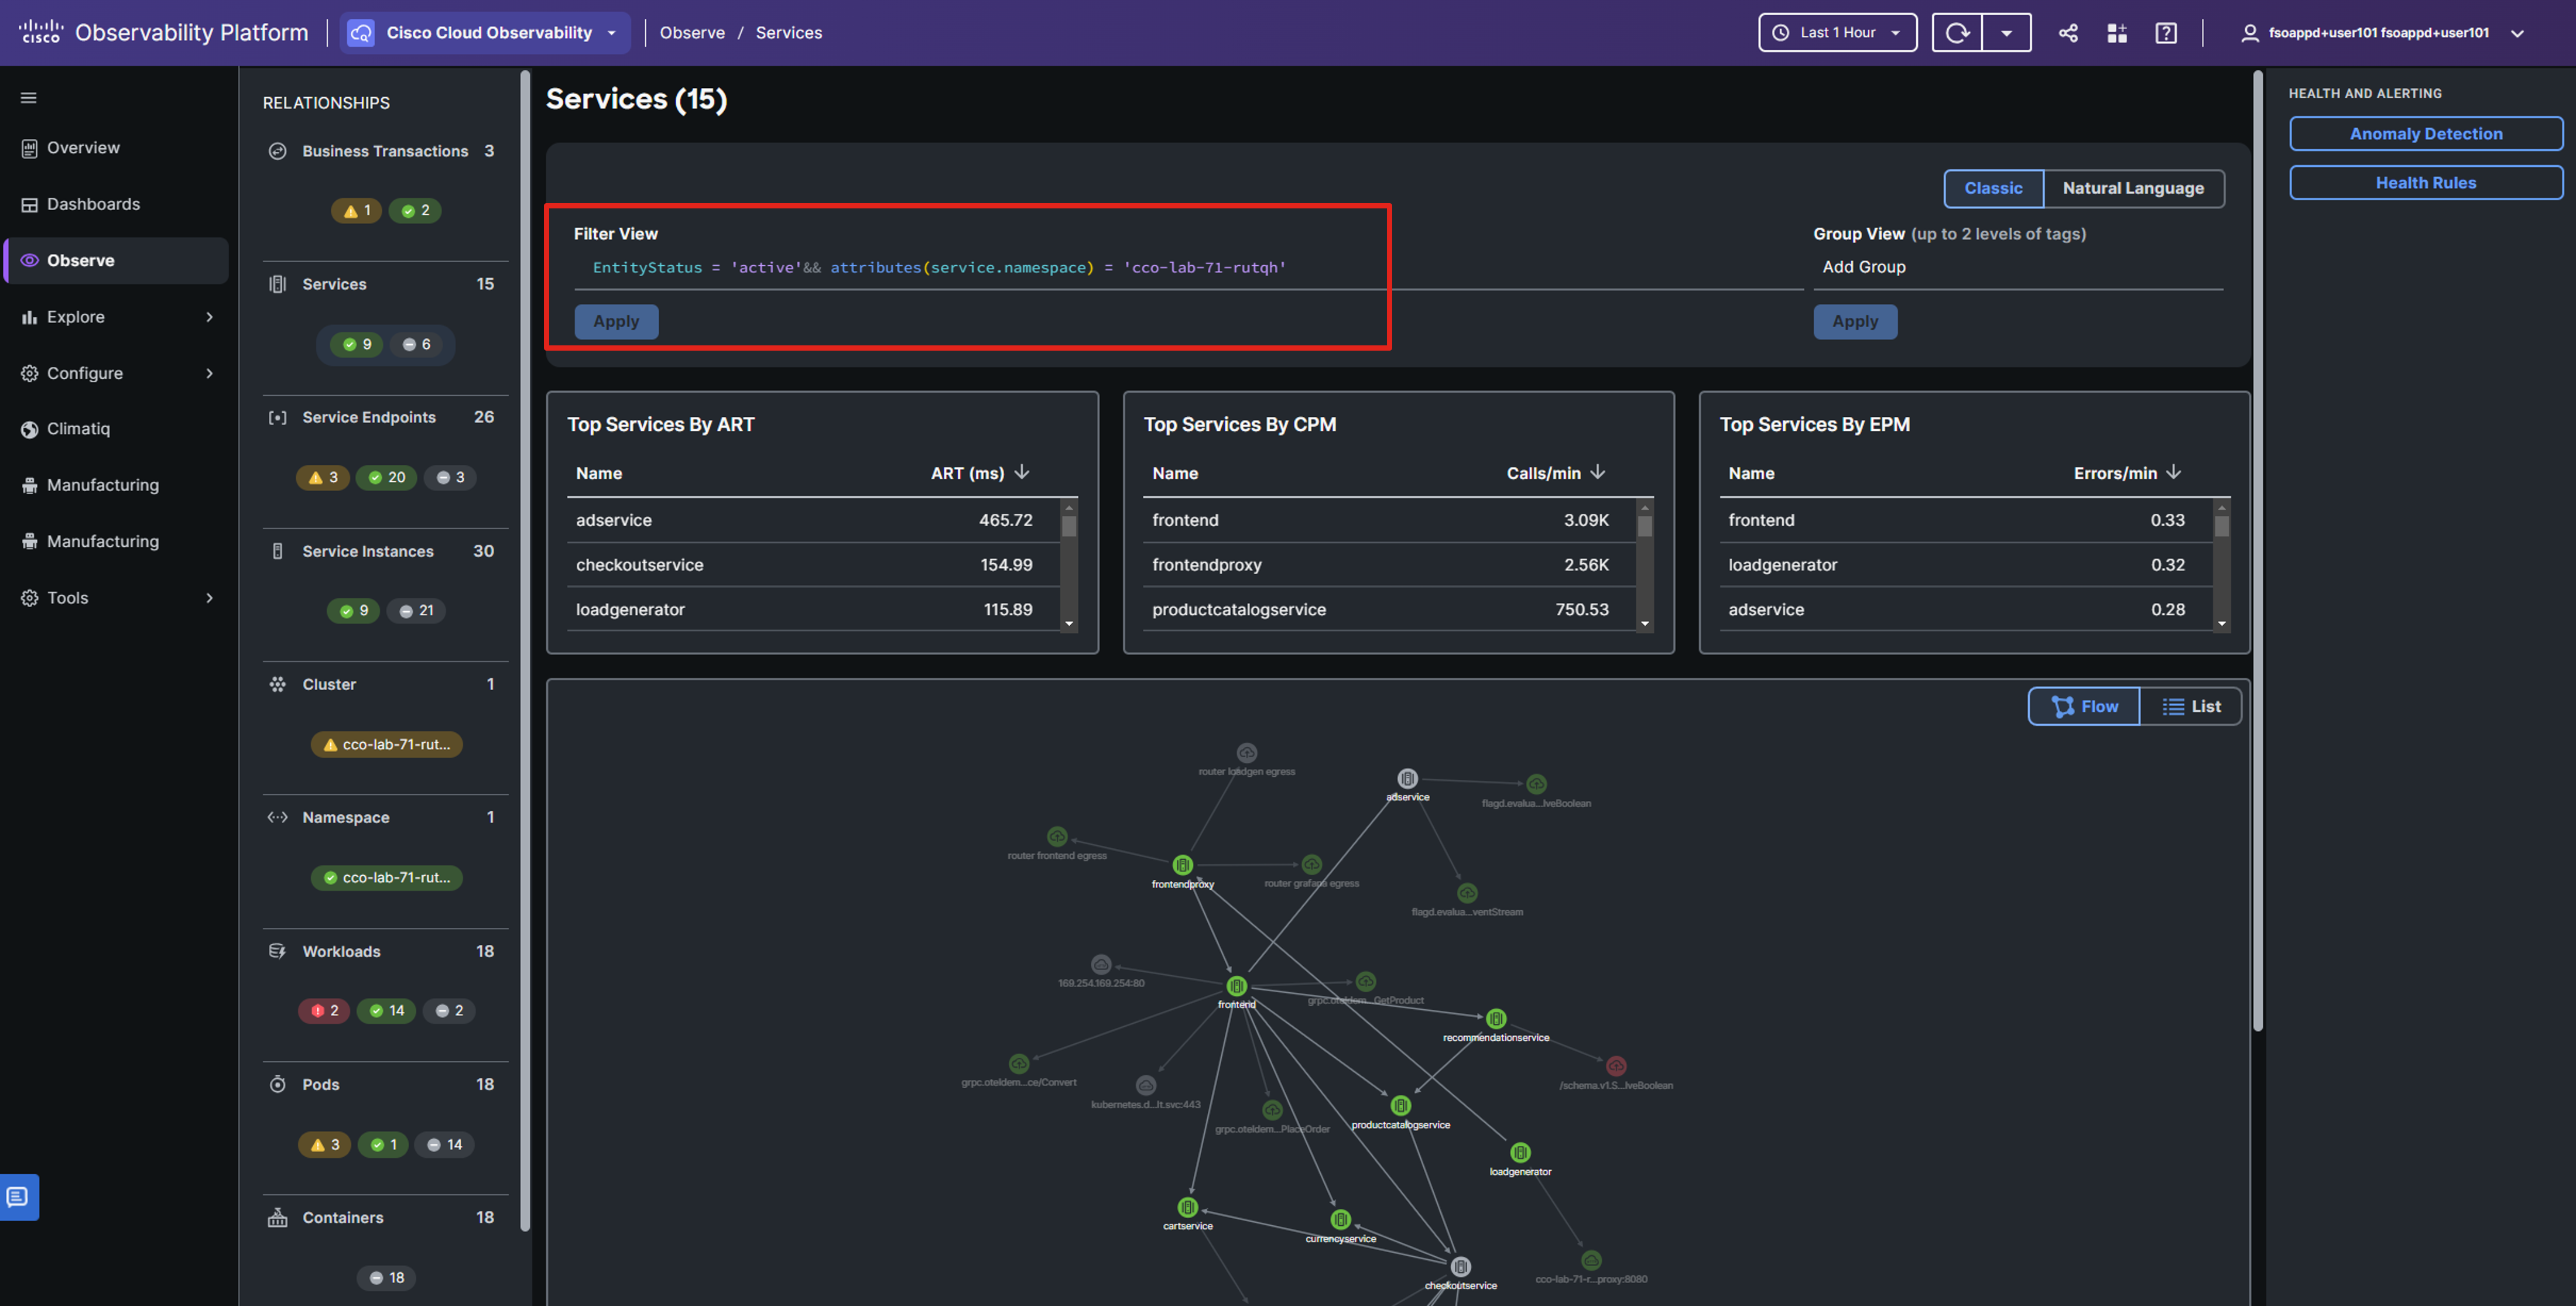
You’ve successfully configured OpenTelemetry collectors to transmit data to the Cisco Cloud Observability platform!
Note: It may take a while for CCO to display significant data, so now is a great opportunity to take a break!
Coming Up Next
In the next section, you’ll utilize the Cisco Cloud Observability platform to examine the application’s performance.